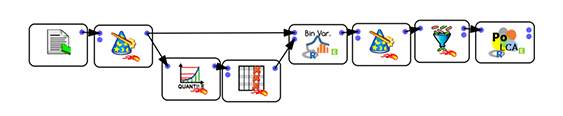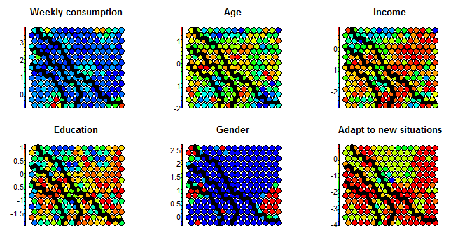
Visualize Clustering with SOM in Anatella / R
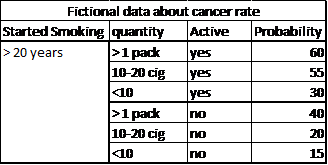
Visualize Clustering with SOM in Anatella / R Note: The data is extracted from Marketing Engineering, with the kind permission of Dr A. De Bruyn. A very complete R code for SOM can be found in the excellent post of Shane Lynn http://www.shanelynn.ie/self-organising-maps-for-customer-segmentation-using-r/ Clustering is a tricky business. while the hardest part of it lies