Segmentation tools
Segmentation techniques can be represented like this:
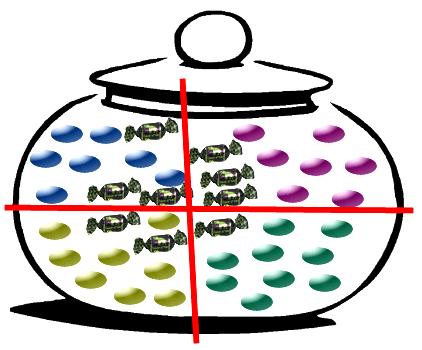
Each candy in the cookie-jar represents a know prospect. The big red cross represents our segmentation: we decided to create 4 segments based on our analysis of our population.
The objective of the exercise here is to create the best ranking: We want to select only the prospects that will buy our product. To create this ranking, we will analyze our population and we will pay a special attention to the people that already have the product (these costumers are represented with a Chokotoff label: ![]() )
)
There are many different ways to define segments of your population. Segments can be defined:
- Using simple business-rules: for example:
- Segment 1 is composed by the men with age<30
- Segment 2 is composed by the men with age>30
- Segment 3 is composed by the women with age<30
- Segment 4 is composed by the women with age>30
Usually, one finds such business-rules using an obsolete In-RAM-OLAP tool to explore the population and try to find “good” segments.
- Using “advanced analytics”: using tools like Stardust (KMeans clustering, Hierarchical clustering,etc.) or SpadSoft.
In most of the time, the segments inside your population have been created ‘by a very smart guy a few years ago‘. In the above example, the criteria that was used to create the 4 segments is the position of the candy in the cookie-jar.
Let’s now create a ‘ranking’ based on our segmentation. A ranking is simply an ordered list that contains all your prospects sorted from the one with the highest probability of purchase to the one with the lowest of purchase.
We can easily compute the “probability of purchase” of the different customers inside a specific segment: it’s the percentage of buyers inside the segment.
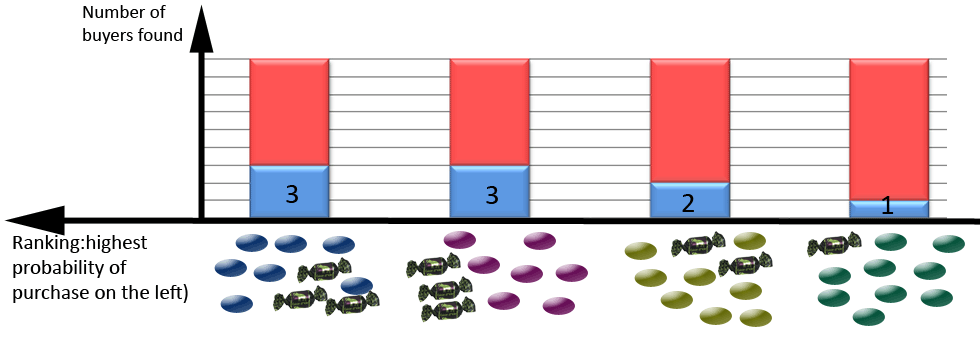
To create our ranking, we will order our segments from the “best” one (the one with the highest number of buyers in percent) to the “worst” one (the one with the lowest number of buyers in percent).
Here is an illustration of the ranking:
The same ranking can also be illustrated in this way (the “Y” axis is now the cumulative number of buyers found):
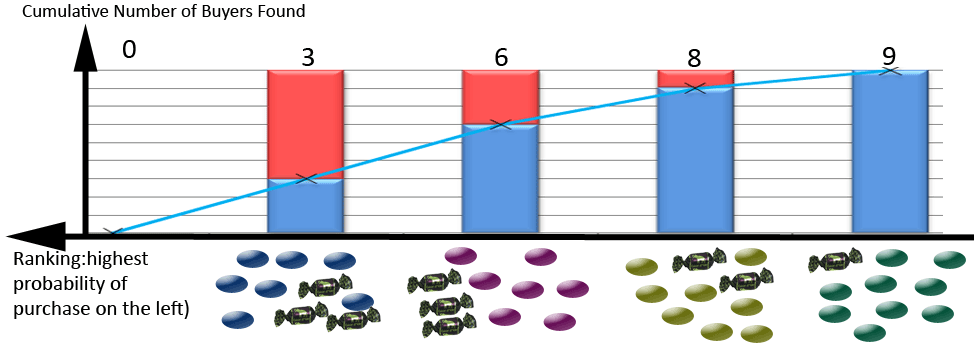
The blue curve in the above chart is named the ‘Lift curve‘. The lift curve allows you to ‘see’ the quality of your ranking. Different ‘Analytical CRM tools’ will have different lift curves. The lift curve directly translates into ROI! TIMi framework includes a unique tool that directly estimates, based on the lift curve, the ROI (in Euros or Dollars) of your marketing campaign. A good “Advanced Analytic” software will be able to directly find all the buyers and it will generate a “high lift curve”. The higher the lift curve, the better your ranking, the higher your ROI.
HIGHER LIFT CURVE = HIGHER ACCURACY = HIGHER ROI