ChatGPT studied thanks to Anatella
Is every answer generated by ChatGPT unique? Or are we overestimating its ability to produce different texts? This is the question IntoTheMind asked myself after analyzing 1000 texts produced by ChatGPT.
The cabinet IntoTheMind compared the similarity between 1,000,000 pairs of texts generated by this artificial intelligence to answer this question. The results are surprising and challenge the promise of OpenAI. Find out in this article the results of this in-depth analysis done with Anatella and what it means for the future of text generation.
ChatGPT: all results in 30 seconds
|
Summary
- Methodology
- Discover how consistent ChatGPT is: the similarity of its answers to the same question
- ChatGPT’s fascinating ability to produce similar answers to different questions
- Bonus: are the texts produced by ChatGPT always the same length?
- Appendices
Methodology: read first to understand the following results
The goal of this research is to investigate how different the answers given by ChatGPT are from each other. This is a complex research project, which I had to divide into several experiments. I present today the results of the first one. Subscribe to my newsletter so that you can see the next ones.
Generation of the corpus researched
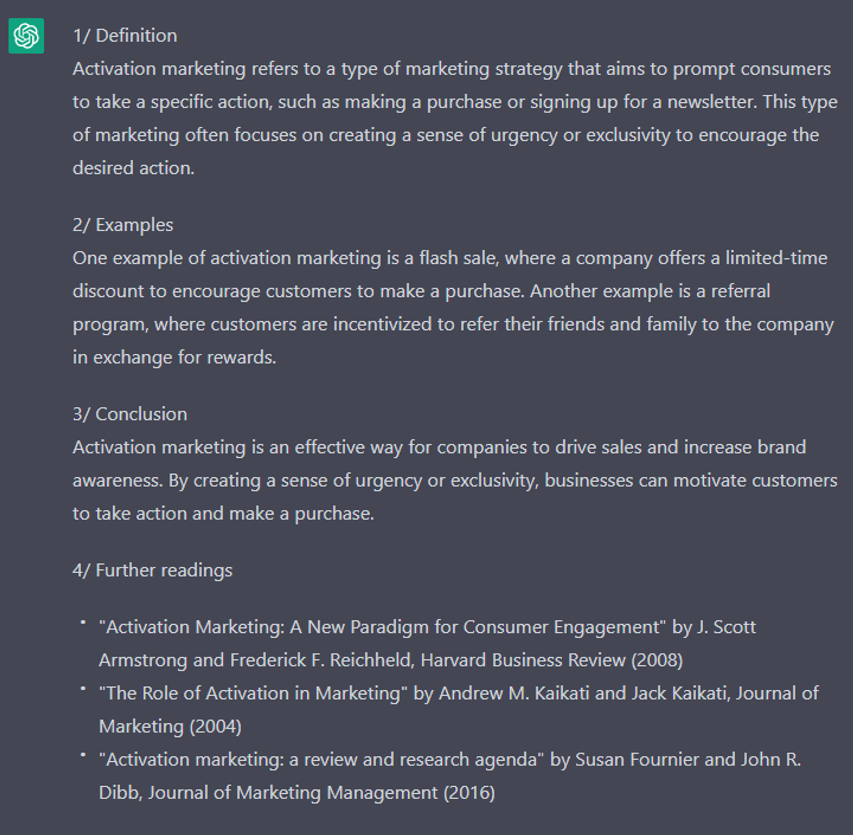
In this first experiment, I asked ChatGPT to write an article on a specific topic (see an example below). An outline was proposed to structure the answers. Twenty topics (see List at the end of this article) were defined. The request made to ChatGPT was always the same. Only the keyword between quotation marks changed.

I want to impose a particular plan to meet the needs of content creators who, when they seek to position themselves on generic keywords, adopt a structure that is very often the same. For this first test, I followed a very basic plan. The second experiment will logically remove the indications relating to the plan of the article to observe how ChatGPT reacts.

Each answer was regenerated 50 times, one after the other, without interruption. When the regeneration process was interrupted by a technical problem, the work had to be started from scratch.
Here is an example of the answer obtained to the question asked above.
Data preparation and processing
The data processing and analysis were carried out with Anatella. The visualization of the data was carried out using Tableau.
This project could not have been carried out without Anatella. This ETL was indeed crucial for at least 2 aspects:
- calculating similarities easily and especially quickly (44 seconds to calculate the similarity between 1 million pairs of texts)
- DE pivoting the data so that they can be imported into Tableau (using Tableau, a maximum of 700 columns can be managed, but my largest similarity matrix had 1000 lines and 1000 columns)
For more information on data preparation, see this article which explain the steps needed to carry out the data preparation.
Discover how consistent ChatGPT is: the similarity of its answers to the same question
First, the objective was to compare the answers to the same question. The similarity of the texts produced was measured thanks to the Dice method. So, I compared the 50 iterations of each of the 20 questions.
We obtain 20 matrices of 50×50 that you can see below. The color gives an idea of the similarity rate. The lighter it is, the lower the similarity. I did not want to clutter the graph with unnecessary details because I intended only to give a “graphical” overview of the whole.
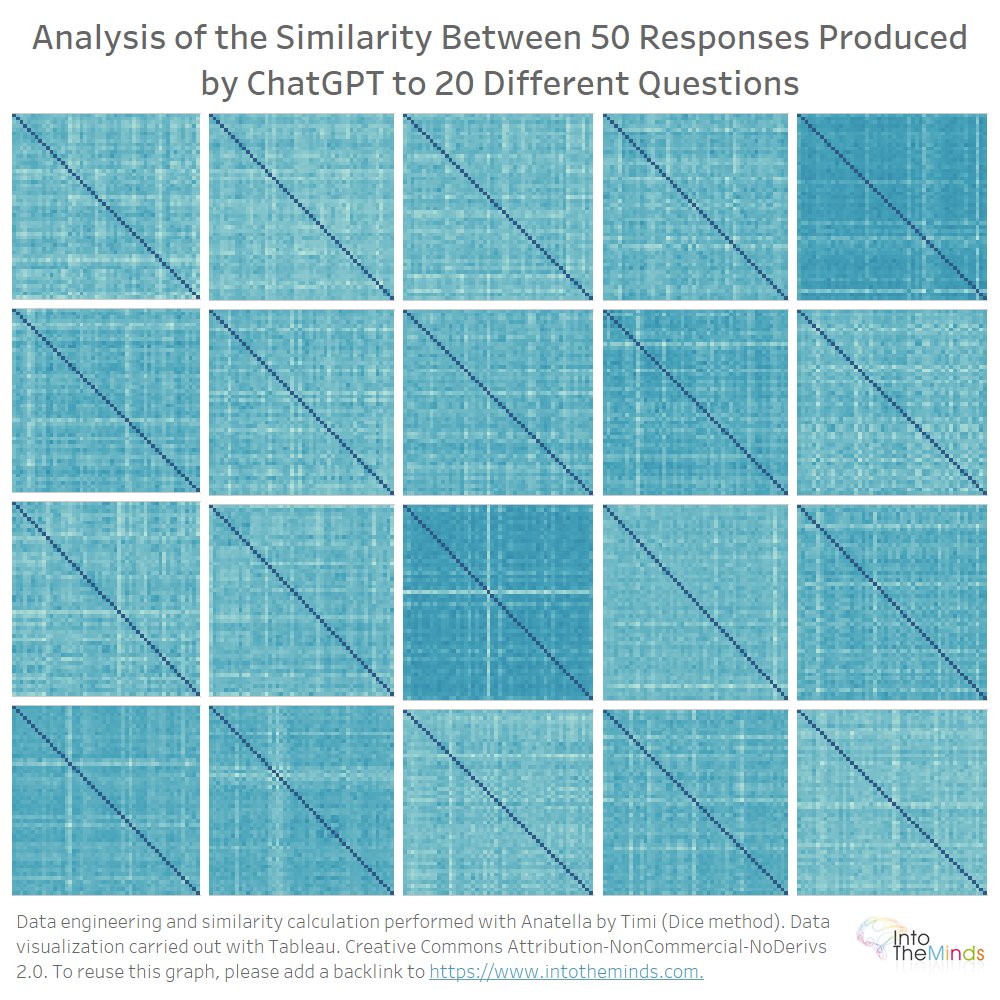
So, you can see visually that the differences are quite pronounced. For some series, all the iterations are similar; for others, there are quite strong variations.
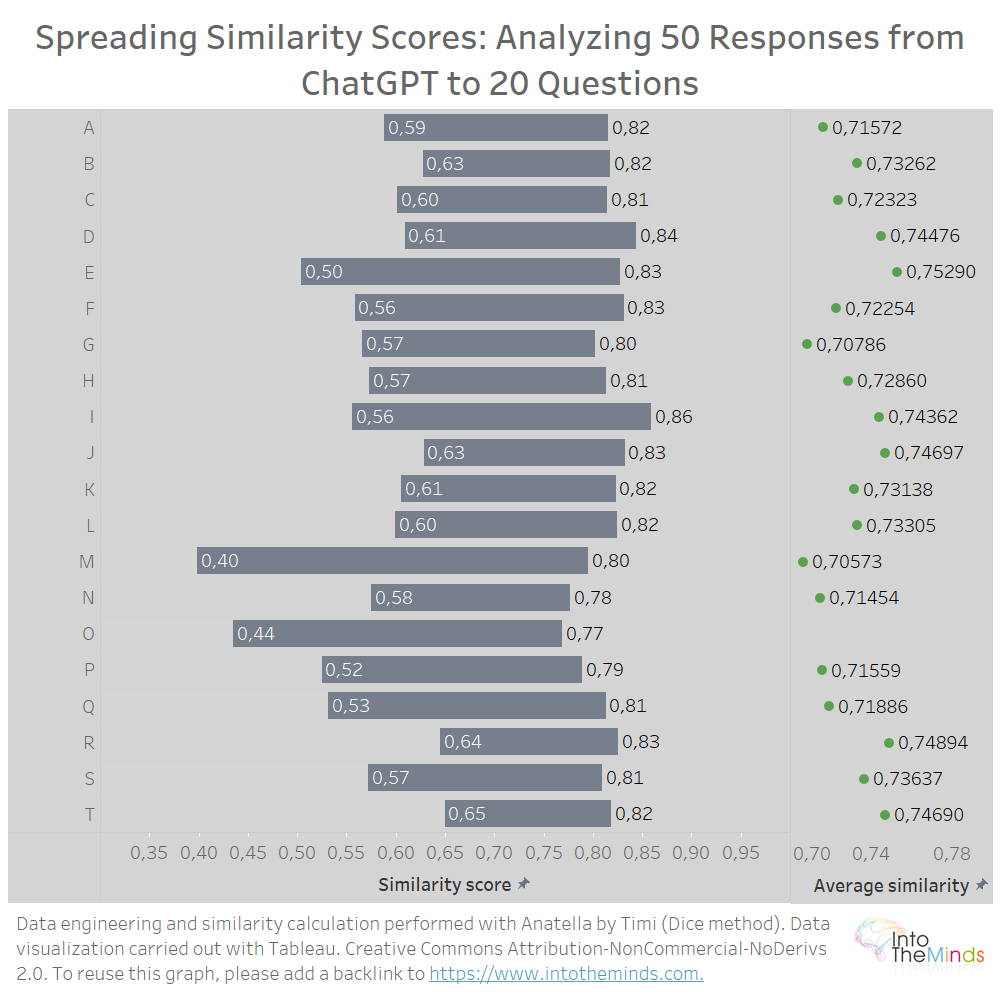
On average, ChatGPT produces similar answers when you ask it the same question several times. Specifically, the lowest similarity coefficient is 0.40 (question M), and the highest is 0.86 (question I). The dispersion of the similarity coefficients is represented in the graph below. You can also read the average similarity for each series. You will notice that all values are between 0.7 and 0.75.
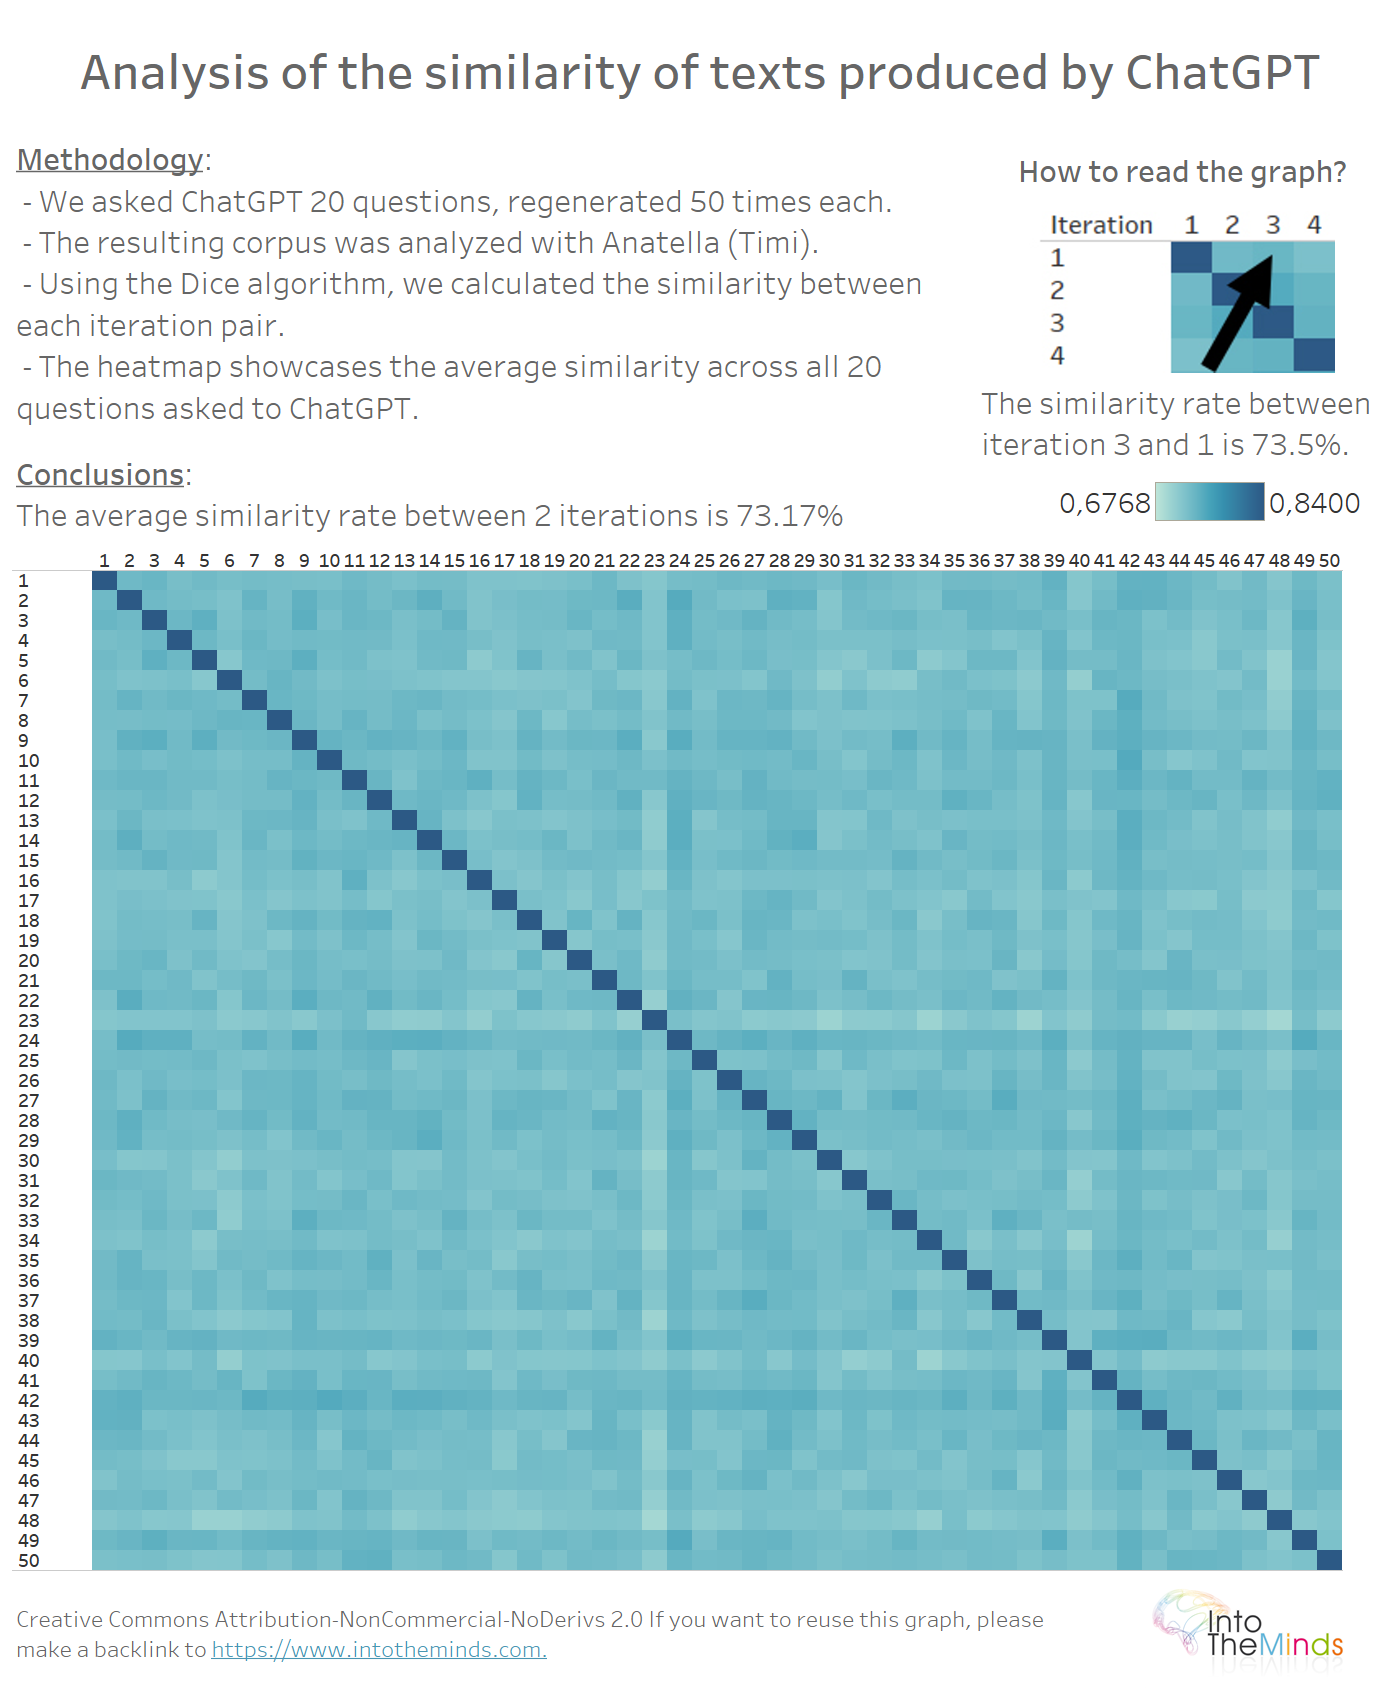
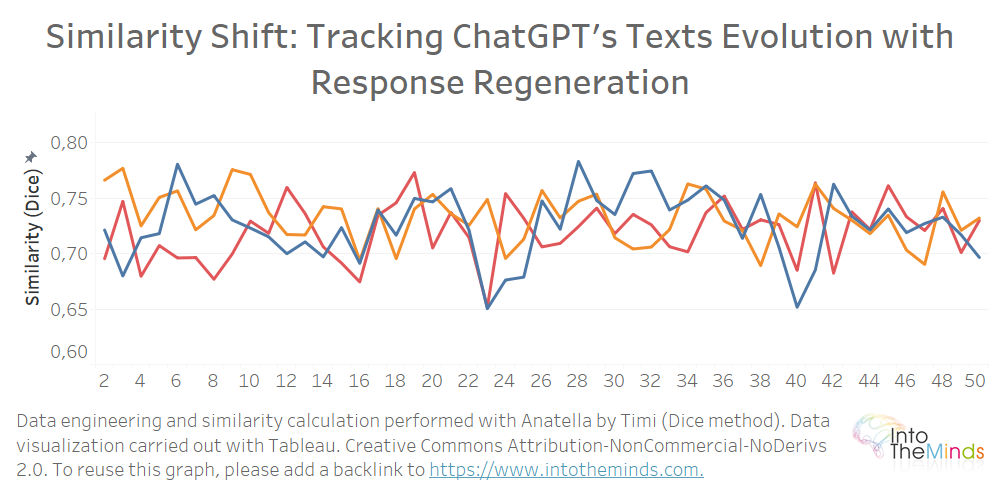
Can we observe a progressive “drift” of the answers as the iterations go on? In other words, does ChatGPT produce, as iterations go by, answers that are further and further away from the first iteration?
To answer this question, it is sufficient to carry out a heatmap between the 50 iterations of the 20 series. There is no particular pattern in the data. This indicates that each ChatGPT response is regenerated without considering the previous one. The average similarity rate is 73.17%.
By isolating a series and comparing each iteration to the first answer, we can see that the similarity is not decreasing. In the graph below, I isolated the series A, B, and C and calculated the similarity of each answer produced by ChatGPT compared to the first text produced. The graph logically starts at iteration 2 since the point of comparison is the initial text (iteration 1).
What can we learn from this analysis?
Here are some lessons to be learned from this first analysis:
- when you ask ChatGPT the same question multiple times, don’t expect to get fundamentally different answers. They are structurally quite similar. This is normal since the algorithmic “mechanics” behind ChatGPT make sentences based on the next most likely word. So logically, we find similar sentence structures from one iteration to the next.
- This research objectively measures the similarity rate between the answers. At the minimum, the similarity rate is 40%. At the maximum, it is 86%. On average, it is 73%.
Two texts produced by ChatGPT on different subjects can be half or 2/3 similar.
ChatGPT’s fascinating ability to produce similar answers to different questions
Our methodology is based on identical questions where only the subject of the query changes. From then on, it becomes possible to compare answers to different questions.
Here is a concrete example. How close does ChatGPT write the texts on activation marketing (topic A) to those on Astroturfing (topic B)? The exercise is similar to the one done in the first part of this article. The difference lies in the aggregation that had to be done of the points related to the same question (series A to T). To perform this operation, the data preparation in Anatella proved to be essential because it was necessary to compare series between them. I will skip the technical aspects and talk to you about the results. That’s why you’re here, isn’t it? 😉
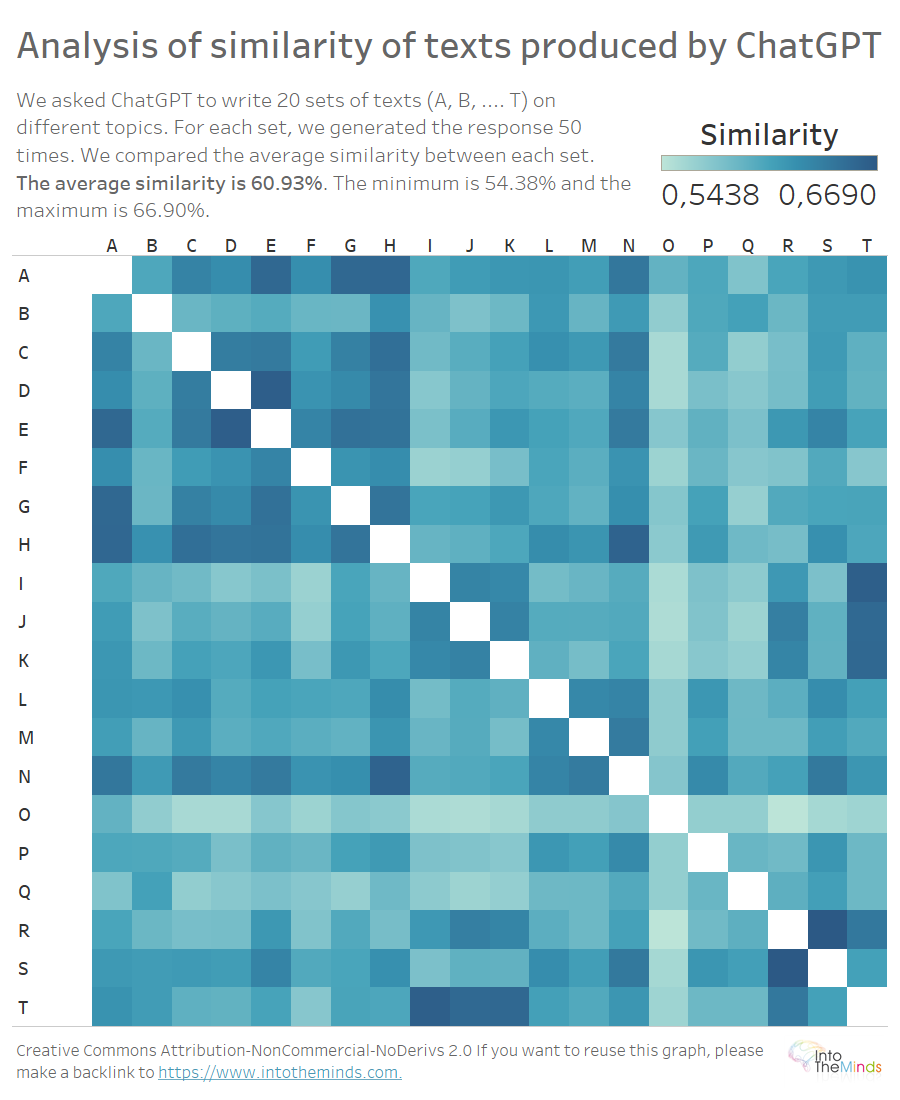
The heatmap above allows you to visualize the similarity between the texts produced for each question. Remember that each letter (A to T) represents a different question. The topic differs from set to set; the plan is the same (definition – examples – conclusions – references). It is reasonable that the similarity between texts on different subjects would be low. It is not. The minimum similarity is 54,38%, and the maximum is 66,90%. The average similarity is 60.93%. This means that in our experiment, two texts produced by ChatGPT on different subjects can be half or 2/3 similar.
What can we learn from this analysis?
The main lesson of this analysis is that ChatGPT can produce similar answers to different questions. The next experiment is an opportunity to broaden the understanding of the algorithm’s operation by not imposing a design. The imposed design has something to do with it.
Bonus: are the texts produced by ChatGPT always the same length?
To finish this research, I propose to explore the variation in the length of the texts produced by ChatGPT. Since a plan is imposed on ChatGPT, the texts should all be equal in length. Here again, this is different.
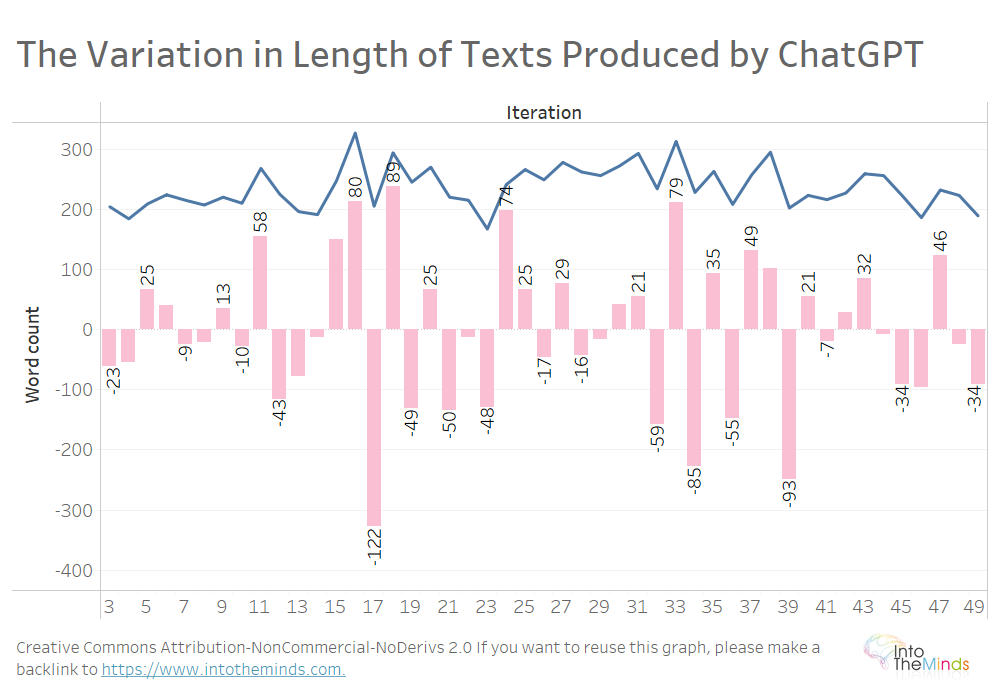
Let’s start by looking at Series A, the 50 iterations of texts produced by ChatGPT on activation marketing. The average text is 237 words long. But between one iteration and the next, the length can vary dramatically. Between iteration 16 and iteration 17, the text produced by ChatGPT drops 122 words, from 328 to 206 words.
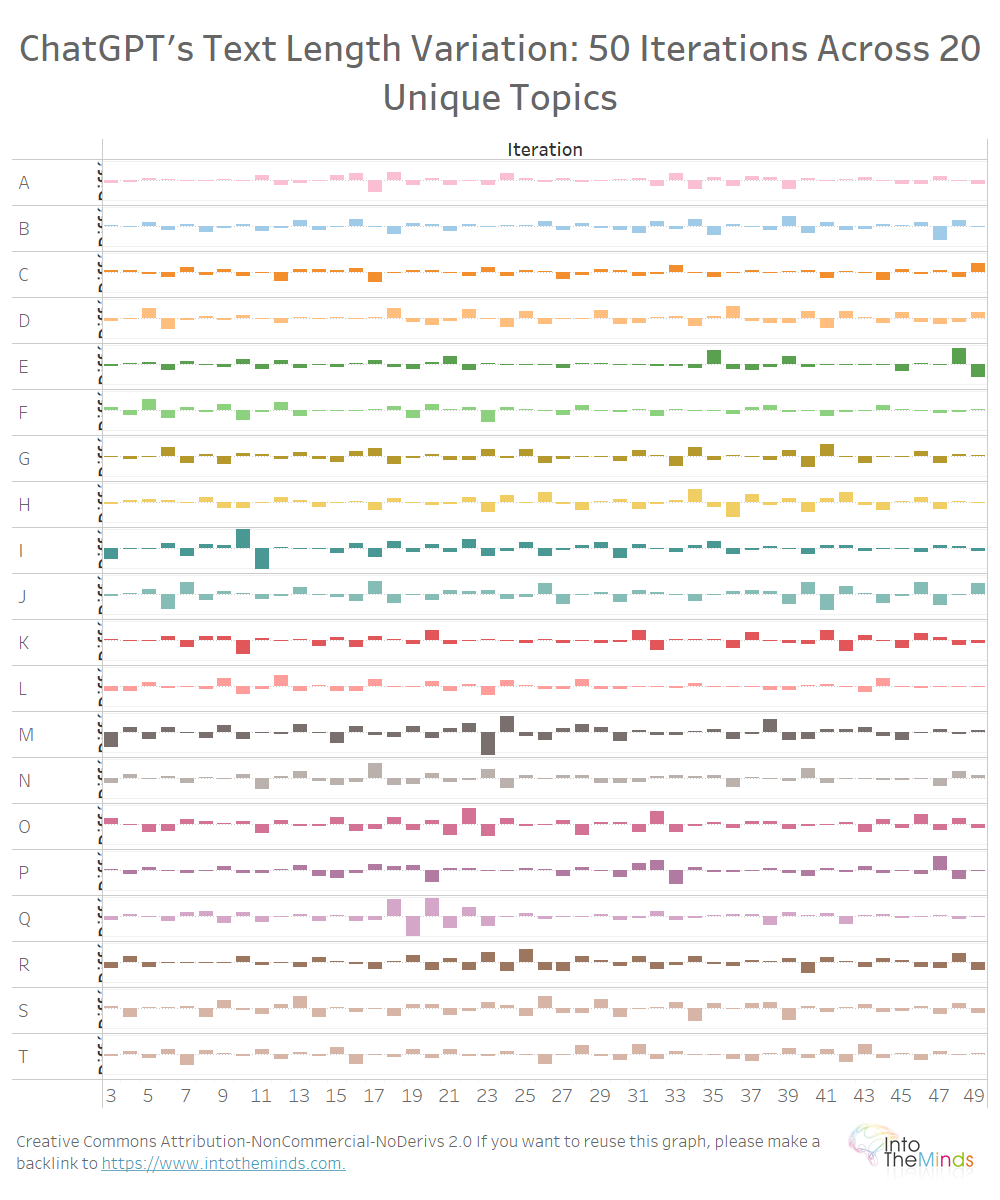
On all 20 topics, the same variations can be observed (graph below). I did not want to make the visualization too heavy, but here are the maximum variations:
- +200 words between iterations 9 and 10 for the topic I (“Net Promoter Score”)
- 232 words between iterations 22 and 23 for topic M (“Celebrity marketing”)
On the whole of the 1000 texts produced, the maximum relative variations were:
- +176%
- -70%
What can we learn from this analysis?
ChatGPT produces responses that vary widely, at least in text length. The 1000 texts produced show maximum variations of +176% and -70%. The length of the texts is thus very fluctuating.
I will regenerate the whole corpus in the next experiment by imposing a word count. This will allow me to research the instruction’s respect and the results’ dispersion around the target.
Appendices
The procedure of data preparation in Anatella
First, Anatella is an ETL (Extract – Transform – Load) software that allows you to work on the data before reinjecting them into another software. It is my favorite ETL for several reasons:
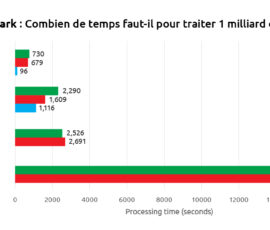
- first, because it is ultra-fast (see a benchmark here).
- secondly, it proposes a much wider range of tools than its competitors. You can, therefore, easily tackle complex problems.
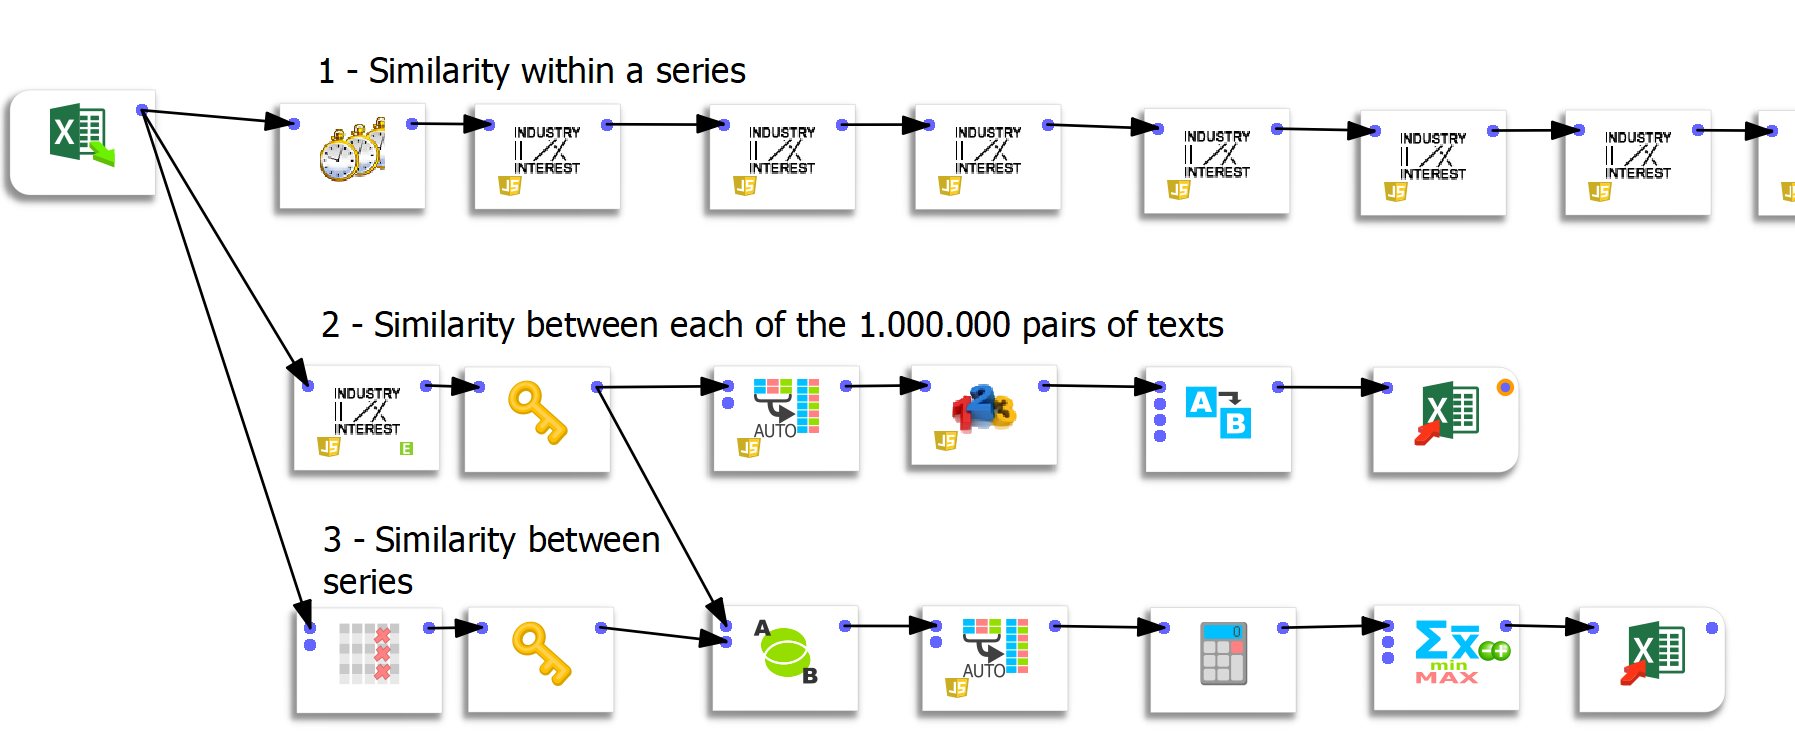
- the editor (Timi) is very reactive and even provided me with a custom feature to easily answer a specific need (calculate the similarity between a large number of text pairs (see flow 2 below)
Three specific data preparation flows were created in Anatella.
Flow 1: compute similarities within a series
This first flow is simple but rather redundant. The following boxes (there are 50) compute the similarity between iteration n and iteration 1. The first 2 boxes allow us to compute the similarity of an iteration concerning the previous one.
Flow 2: computation of the similarities between each pair of texts
For this flow, I thank Frank Vanden Berghen for providing me with tailor-made functionality. I have already spoken at length about the qualities of Anatella, and the speed of execution is an advantage over other ETLs. The challenge here was to calculate the similarity between each pair of texts quickly. Knowing that there were 50 iterations for each of the 20 questions, this represented 1000²=1.000.000 possibilities. Let me underline here the extreme speed of the process since the calculation of one million similarities takes only 44 seconds.
Anatella’s “unflatten” function proved very useful in this exercise. To inject data into Tableau, the data must be “unflattened .”However, Tableau only manages a maximum of 700 columns. Since the matrix is 1000 columns long, it was only possible to visualize the data by preparing them outside Tableau.
Flow 3: calculation of the similarity between series
The last flow generates a matrix between series. It is, therefore, a 20×20 matrix. The “group by” function before the export to Excel allows us to average the similarity values.
List of topics
Here is the List of topics that have been submitted to ChatGPT.
| Reference | Subject |
| A | Activation marketing |
| B | Astroturfing |
| C | Gender marketing |
| D | Marketing as a service |
| E | Marketing automation |
| F | Emoji marketing |
| G | Reactive marketing |
| H | Street marketing |
| I | Net Promoter Score |
| J | Customer experience |
| K | Customer Lifetime Value |
| L | Brand safety |
| M | Celebrity marketing |
| N | Buzz marketing |
| O | call to action |
| P | Newsjacking |
| Q | Microblogging |
| R | Social CRM |
| S | Social media planning |
| T | churn rate |


