What’s the best machine for data science?
A recurrent question in many data science blogs is “hey guys, what machine would your recommend to do data science?”.
The question is very interesting, as there isn’t a single answer to it.
For example, if you plan to work in a cloud environment (note that in most cases, this will end up costing much more than buying a good PC), any laptop will do as it won’t do any work. But, you should still select a Cloud server that follows the guidelines of this post: There are now cloud solution providers that offer quite good bare metal machines!
If you’re planning to do images or video processing, you basically need a solid GPU, or access to a GPU cloud (this is one of the few instances in which the cloud actually makes sense in data science).
Nowadays, almost all the algorithms that are used in data science are running on a single core/thread: i.e. They are not able to use more than one of the many Cores/Threads that are available on your server. This means that, usually, it does not make any sense to have a CPU with dozens of cores (i.e. a CPU with a very high score on the “multithreaded rating” scale: i.e. in other words, a CPU with a very high score on the Y axis in the charts below) since only one core will be used. It’s much better to have a CPU with a more limited number of cores (e.g. around 8) but with each core running at very high speed (i.e. thus a CPU with a very high score on the “singlethreaded rating” scale: i.e. in other words, a CPU with a very high score on the X axis in the charts below). This is particularly true if you are working in R or Python since all the R & Python execution engines are always running on 1 core/thread only (although there exists some very special packages that uses internally more than 1 core: For example: the package “doParallel” in R). Python is particularly slow, so it’s more important than ever to properly select a good CPU with the highest singlethreaded rating as possible so that you get something that will not make you depress about it. R will usually be faster if you code properly, but it’s execution engine is still limited to single-thread speed. Still, some modeling libraries (xgBoost, for example) will makes full use of available processors, and might justify having more cores.
If you’re planning to do data science with Anatella, because you know how easy it is to process billions of records on a single PC/server, then you will want something in-between, and the answer might not be that straightforward. Let me explain that subject in more details. By default, an Anatella data transformation graph runs using only one CPU. But, 99% of the time, you can re-factor your Anatella data transformations in such a way that you use all the Cores/Threads available inside your CPU. Most of the time, it does not make sense to devote some time to do this refactoring (since Anatella is already so fast on 1 core!) and your graphs are running on only 1 core. This re-factoring process is only useful when manipulating very large data volumetry or when the speed of your transformation is of the upmost importance. In such uncommon situation, it might be useful to get a CPU with a high core count (and, anyway, i would not go above 32 cores, because the Amdahl’s Law teach us that it’s useless to go higher).
There is a great resource to compare the performance of the CPU’s on the CpuBenchmark.net website but the organization of this website makes it difficult to figure out which CPU is the best when comparing CPU’s on multiple criteria. So, let’s use TIMi/Anatella to figure out what’s the best CPU for data science! (and especially for Anatella!)
To properly choose a CPU, we need to consider two dimensions: the single thread speed (because most algorithms in data science cannot be parallelized/distributed) and the multi-thread speed (because when data is big, you need to run various processes together, and TIMi Modeler make extensive use of multi-threading). So, in this script, we are interested in the top CPU’s listed in the following two pages:
We created a script that you can Download here (html files already included), and run it to get a basic scatter plot, in which we see the best 175 processor distributed on two dimensions (the X axis is the “SingleThread Rating” score and the Y axis is the “MultiThread Rating” score):
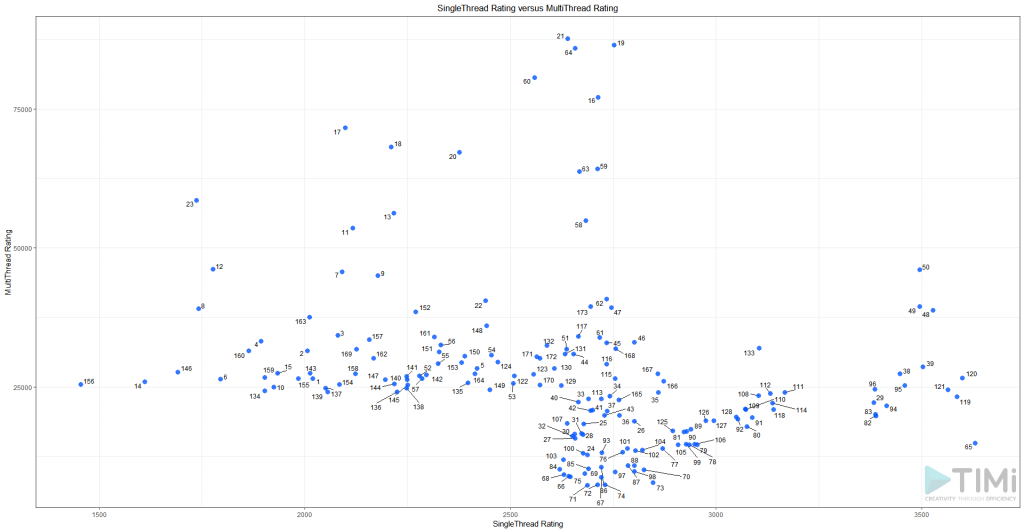
Something interesting emerges from this: There seems to be a cut-off point at 2000 on the X axis, for the Single Thread speed. As this KPI is our main bottleneck, let’s filter out those with less than 2000, and add a few options on our plot:
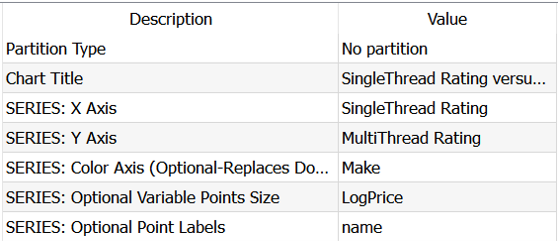
We want to better see AMD vs Intel, so we’ll plot the color as the “Brand”. To get an idea of the price, we’ll put the “log(Price)” as the bubble size. And we’ll also put the “CPU Name” on the plot: Now that there are less of them, having to look at a table on the side makes no sense.
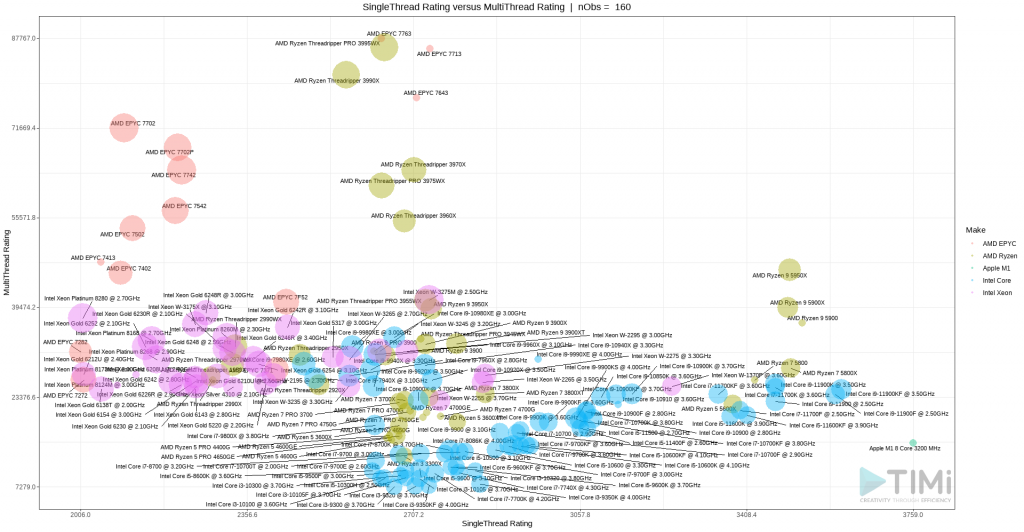
This is still a bit messy, but this helps us to better see another cluster of interest at the right end of the chart. The AMP EPYC and AMD Ryzen Threadrippers are incredible in terms of multi-thread performance, which make them the winners to create “web servers”, but they lack in single thread performances. Let’s focus on the scores above 3000.
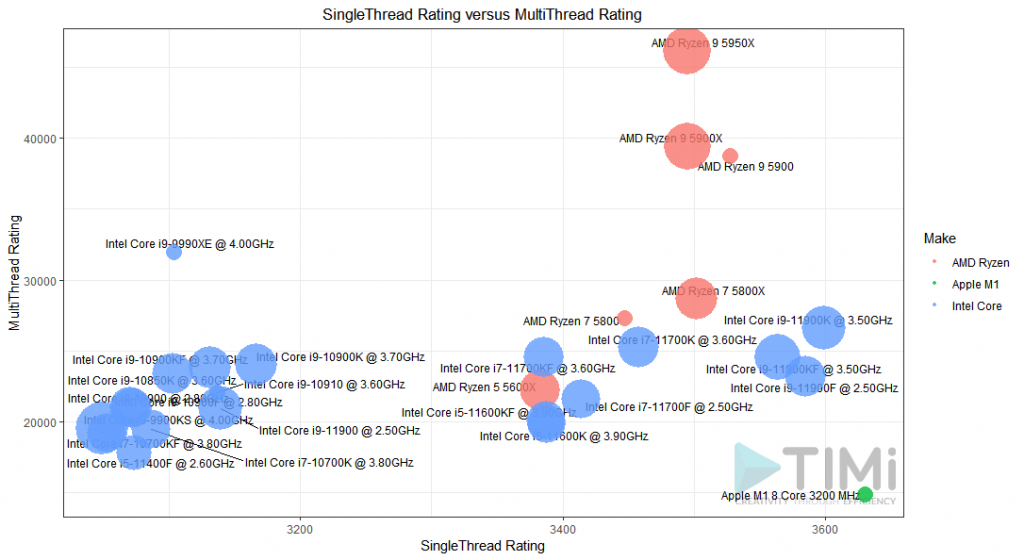
The AMD Ryzen 9 5900 is definitely the best value for money! While the three new Intel i9-11900K, i9-11900KF and i9-11900F are marginally better on single thread speed, their price is much higher and the multi-thread speed of the Ryzen 9 just smokes them!
If money is not a problem, the best CPU of all is definitively the AMD Ryzen 9 5950x ! Indeed, it has one of the best performances in single thread and, at the same time, it also offers one of the highest MultiThread score thanks to its large count count. It has 32 cores! This means that, even the most demanding parallelized applications (such as some refactored Anatella graphs optimized to use all your Cores/Thread) will run at blazing speeds! I never thought I’d see the day, but yes: go AMD!
For single thread data science project with R & Python, it seems a MacBook might be your new best friend! But beware: If you are using linear algebra routines (or practically any heavy duty mathematical libraries) in R or Python, you need to stick with Intel since all the linear algebra routines in R & Python have been optimized to use the very fast vectorized intructions set that is only available inside Intel CPU’s (SIMD instruction) and they will thus run much faster on Intel CPU’s. the M1 is not optimized for SSE3 and might end up much slower than the others… And if you are married to PC and Windows, then those new i9 from Intel will definitely work for you.
NoteThis is only valid as of may 2019. Things change quickly, you may get slightly different results from the script when you run it with live data!
Technical details:
This small script combines web scraping and text mining techniques with Anatella. The first part of the script gets the parts of the table that interest us, namely the url, name and performance, from both the “Top high-end CPU list” and the “Top Single-Thread CPU list”. As they are sorted, we keep the top 100 from each page, we append, we remove the duplicates, and we are all set.

The second step is to simply download all the URL that have been extracted. For this, we use the MultipleDownAndUpload action, which requires an URL and a local path as parameters:

The last step is the tricky one: it extracts all the information we want from the webpages downloaded during step 2. Your best friend here is the extractRegExpPosition action. We extract the value associated with a label somewhere in the text, and give it a specific name. This allows us to fill-in the dataset used to make all the charts. Finally, we save our dataset in an Excel sheet.


