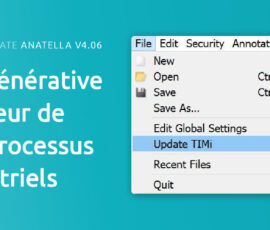
We’re very enthusiastic to share with you some great news! We’ve just rolled out a new Youtube tutorial that’s all about blending Anatella’s magic with PowerBI’s visualization capabilities. For those of you who’ve been with us, you know we’re all about making data visualization not just smart, but also accessible for everyone.
Our head of data science, Lucy Gunawan, has put together this easy-to-follow guide where she walks us through creating dynamic Power BI dashboards directly in the cloud using Anatella. It’s like watching a master chef at work, but for data! 😉
Anatella isn’t just about machine learning or AI. We’ve seen a ton of our customers using Anatella for data preparation tasks, to create complex KPIs. …And thereafter display these KPI’s using Tableau, Qlik and powerBI. Affordable and secure cloud dashboarding solutions are always an interesting topic. ..And, now, we’re taking this to a whole new level with our ultra easy integration with PowerBI.
So, whether you’re a data guru or just starting out, this tutorial is your ticket to becoming a dashboard wizard. Let’s dive in and transform those numbers into stories!


