Boost analytical culture in your company
It’s very good to want to boost the Analytical Culture in your company, but why would you want to do that in the first place? We must not lose sight of the fact that the final objective of data analysis is to make more profits, save lives or other more exotic uses. You don’t engage in analytics for fun. You have to get a result. Unfortunately, the vast majority of analytical projects are failures, as demonstrated by this infographic:
Luckily, there is a way to ensure the success of your analytical initiatives: the Analytical Culture. So, if you are serious about your data initiatives, if you want to ensure that your efforts and investments in manpower and time are useful, there is one solution: adopt an Analytical Culture.
The traditional methodology
Typically, to solve an analytical problem, one will follow a 5-step methodology described below. Nothing new here: this is typical of what you will see if you use analytical consultants.
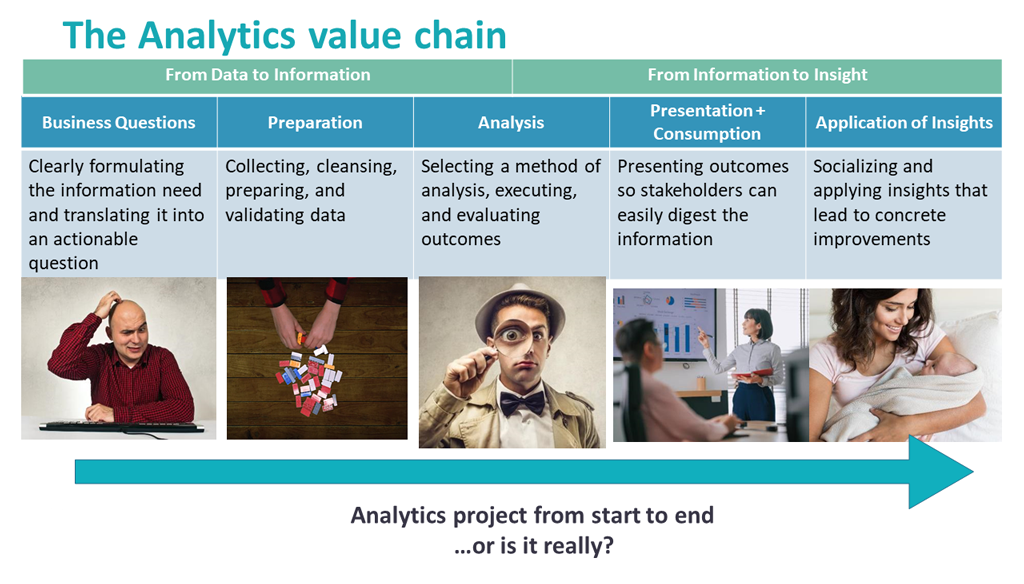
We start by asking ourselves a business question, then we prepare the data to be able to answer this question. Then we analyze the data. Then we present the results to the people involved, typically the CEO, CMO or any other stakeholder who is affected by these results. In the analytical field, the word “Stakeholder” has a special technical meaning: it represents all the people interested in the analytical results. Then, we deploy the results in production so that they have a real impact on the business.
So, we reviewed here above the 5 steps of an analytical project from start to finish (…but is this really how an analytical project should be done?). Now we’re going to look at the people who carry out these five steps.
The 8 profiles that use data
Typically, there are 8 different profiles that use or consume the data.

The CEO runs the company. The IT Guys makes sure that the PCs work well. CDPO takes care of ensuring the confidentially of the analyzed data in accordance with the European legislation (i.e. the GDPR law). The data engineer buys machines in the cloud to optimize the infrastructure to “handle the load”. …There is a common point to all these profiles: None of them look at the data.
Then there is the ‘StakeHolder’. In the literature, this profile is sometimes also referred to as the “business stakeholder”. He is typically the one who makes the company run: he knows the business. He knows how to make profits, how to save lives, etc. The SQL Guy is the one who stores the data in the database, and to do that, he regularly has to perform transformations on the data. The “Business Analyst” is the one who understands the data well and is able to create relevant KPIs or predictive models, to optimize the business. The data scientist writes complex code, studies machine learning algorithms and optimizes their parameters. There is still one last profile: the “data miner” profile. Around the years 2000, there was no clear separation between these 3 last roles and, very often, it was the same person who did everything: it was the “data miner”. But they are increasingly rare nowadays. A good advice: if you are lucky enough to have a data miner in your team, don’t let him go! He is worth his weight in gold!
The five prerequisites for an analytical culture in a company
The analytical culture is based on the simple idea that those who understand the problem to be solved should be the ones to solve it. Thanks to this idea, your analytical initiatives succeed and the analytical culture spreads throughout your company.
The idea is simple but it is hardly ever implemented because it requires 5 key elements, 5 prerequisites, that are hardly ever available in companies.
- A tool that allows an iterative approach
- A self-service tool
- A federator tool
- A tool that allows easy automation
- A tool with no variable costs
1. A tool that allows an iterative approach
Wrong approach: the waterfall methodology
At the beginning of this article, we saw the traditional way of doing analytical projects. It’s called the waterfall approach and it has one big flaw: it doesn’t work because it’s not iterative. This waterfall approach is attractive but, in analytics, it doesn’t work. It’s all the more unfortunate that this approach is imposed on you by more than 90% of the tools used to carry out data science projects and analytical projects. In data science, when you have developed a piece of code to answer a precise business question, it is very common to come back to this piece of code after a few months and modify it in depth because you now have a better understanding of the business problem to be solved. For this, “data science” is a very special field. Unfortunately, almost all developers who try to add data science functionality to their solutions do not understand this iterative need and, in the end, there are almost no analytical solutions that allow for easy and quick iteration.
And the consequence is directly visible: Despite the fact that the technology looks like it’s progressing, the number of failed analytics projects is increasing. And it’s no suprise, because despite the best will of the people involved, if you impose a lousy waterfall methodology on them, it’s not going to work.
The Good Approach: The iterative approach
A first good idea is therefore to abandon the “waterfall” methodology and replace it with an iterative approach. What does this mean in practice? It means that the analytical process is now represented like this: with a loop that represents the iterative nature of the process.
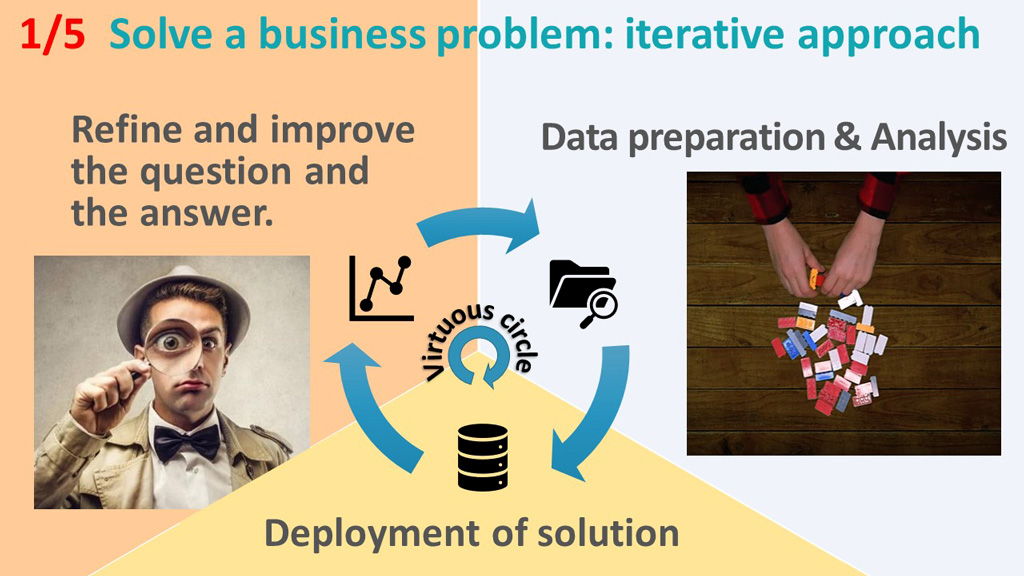
The iterative approach is the first of the 5 key points that enable your company to adopt an analytical culture. How does it work? First we prepare the data and analyse it. Then we deploy and look at the results. This then leads us to review how we answered the business question and refine that same business question to improve our approach. As our business question has changed, it is necessary to change the data preparation, to be able to answer the new question and then we start a new iteration. It’s really an iterative process and, with each iteration, the results and the questions are improved to deliver more and more value and knowledge for your business. This ultimately leads to a virtuous circle that ensures continuous improvement of all the processes within your company.
2. A self-service tool
Of course, what we would like to do is to do as many iterations as possible in as little time as possible. So, what’s blocking? What takes time in this virtuous circle?
What’s slowing down everything is the data preparation. It takes up 80% to 90% of the working time. And this is a known fact: anyone who has ever done a bit of data science knows this. Here are three newspapers that explain that the data preparation takes 80% to 90% of work time:
- Forbes magazine did a survey on the subject and they came to the same conclusion: 80% of the work time of an analytical project is spent on data preparation.
- Similarly, the New York Times magazine says exactly the same thing: data preparation takes up 80% of the working time of an analytical project.
- And InfoWorld magazine repeats the same thing: data preparation work takes up 80% of the work time of an analytical project.
So the data preparation is the real center of the problem. It consumes 80% of the work time and it is crucial: without a good data preparation, any further analysis is doomed to fail.
In an analytical project, it’s all very well to use ultra-complicated and high-performance machine learning algorithms, such as TIMi Modeler, but that’s not the real center of the problem: the real center of the problem, the crucial part when you’re doing analytics, is to make sure that the data preparation is well done.
Who will do the data prep?
If we want data preparation to be well made, we still have to answer one question: Who will do the data preparation? It’s important to answer this question correctly because the data preparation is the real center of the problem, so you can’t screw it up. Moreover, the data preparation depends on your current business question. In other words, different business questions give different data preparations. And this business question, it changes over time: at each iteration, it’s refined because we understand the problem to solve better.
When I say “we”. Who are these people who understand the problem better and better? Typically, it will be either the business analysts or the stakeholders. But very often, it will be just the stakeholders because they are the only ones who understand all the little business subtleties that are necessary to refine the analysis. They are the only ones who have over 20 years of expertise behind them to see if the results are consistent.
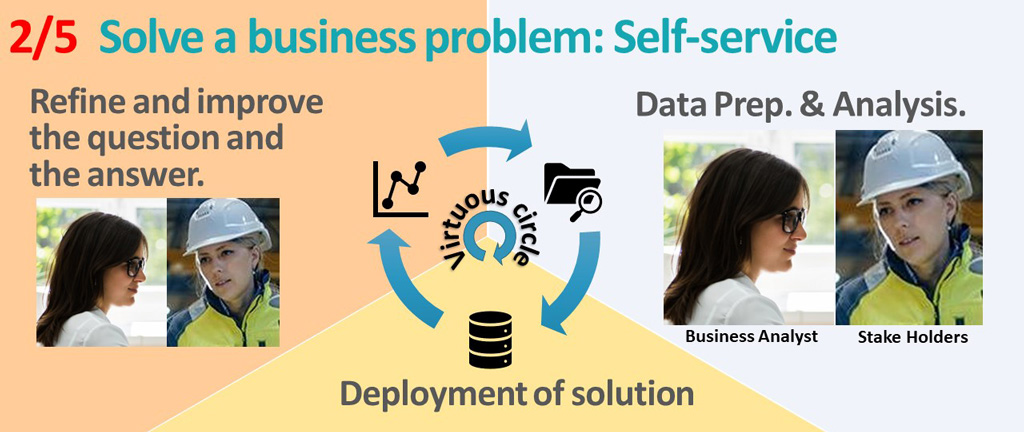
Now, there are also some exceptional situations where we have access to data scientists who are really dedicated to their employer and, in this case, they make the effort to learn all the little intricacies of their employer’s business. …But this type of employee is increasingly difficult to find, especially in a context where data scientists are “leapfrogging” from one company to the next every 3 months.
Well, obviously, don’t make me say what I didn’t say either: I didn’t say that you should force stakeholders to write code. That’s not their job, and forcing them to code in barbaric languages is just a waste of everyone’s time. That’s not where the stakeholders bring the most value to your company.
Those who understand the problem to be
Or, at the very least, they must be part of the solution.
solved must be the ones to solve it
It means that stakeholders must be an integral part of the problem-solving process. They must be able to intervene to “correct the aim” at each iteration, thanks to their large business expertise. In fact, we could summarize in a single sentence all the elements that have been discussed so far: All the elements that are allowing us to get successful analytical projects. This sentence is simply: “Those who understand the problem to be solved must be the ones to solve it“. This sentence sums up everything we have said so far and nobody can really criticize it.
So I would go even on step further. I would say: «Those who understand the problem to be solved must be those who do the data prep.». …because doing a good data prep is practically equivalent to solving the analytical problem anyway, because the rest of the process is practically negligible.
This rule of «Those who understand the problem to be solved must be the ones solving it.», seems obvious but, in practice, it’s almost never applied because, to make a good data prep, it is necessary that stakeholders and business analysts both spend time together on it.
…and for that, you need a data preparation tool without code, also called “self-service tool”. The self-service aspect of the data preparation tool, it sounds a little bit insignificant, but, in reality, it’s a critical feature to allow stakeholders and business analysts to do the data preparation together. “Self-service” is the second key point that allows an analytical culture to spread throughout your company.
3. A federative tool
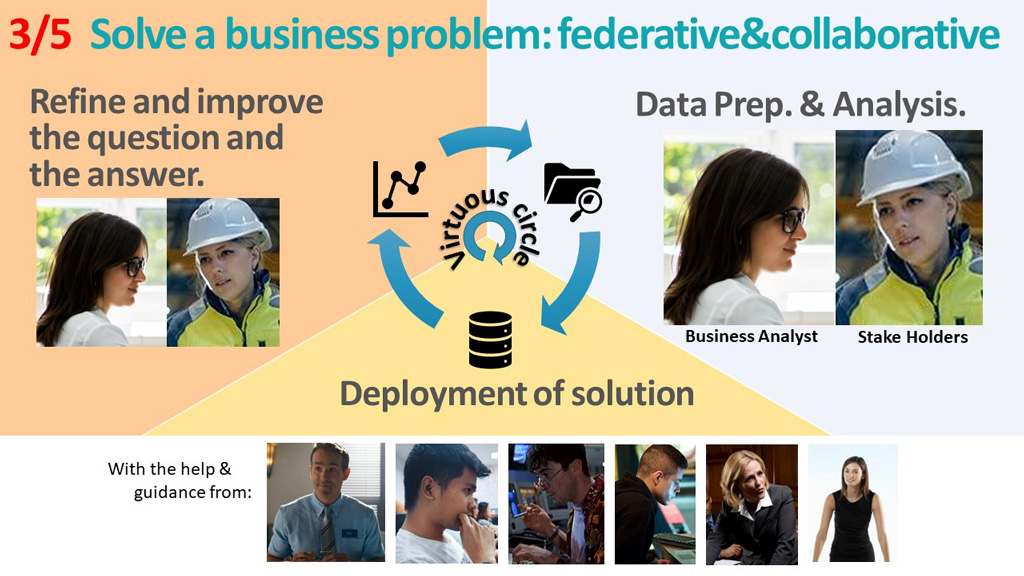
A self-service data prep tool is good, but it is not yet enough. Indeed, Business Analysts and Stake Holders must collaborate with the 6 other profiles to achieve a meaningful data analysis. They need to be able to easily interact with the SQL Guy, the data scientist, the data engineer, the IT Guy, the CDPO and the CEO. So, in short, you need a federative tool that allows all the profiles to collaborate around the same objective: To solve the current business problem. The federative aspect is the third key point that allows an analytical culture to spread throughout your company.
4. A tool that allows easy automation
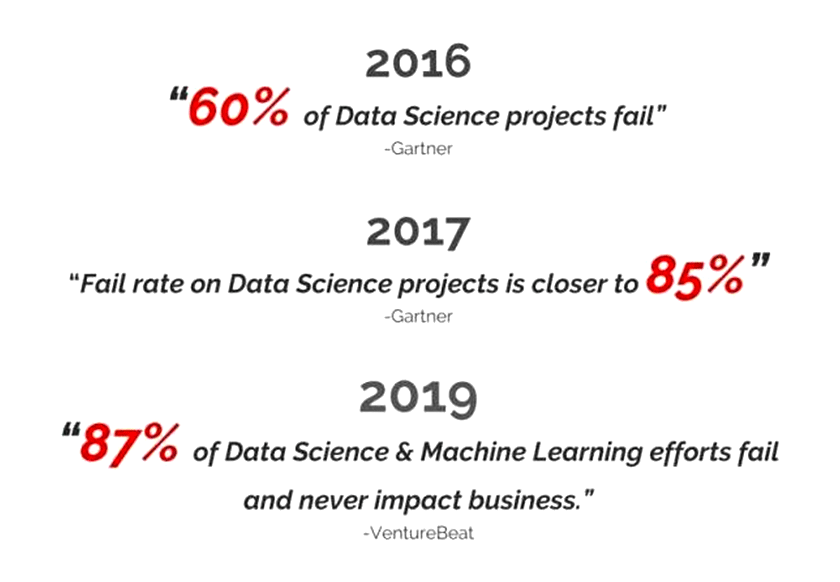
In the infographic here above, we can read that “87% of analytical projects never have an impact on the business.” What does that mean? It means that analytical projects remain in the embryonic stage, without being put into production and therefore without impacting the business. …And that’s actually what you see when you arrive in a company that is starting out in the field of analytics: there are lots of initiatives on all sides, lots of motivated people but nothing that goes into production.
So, a fourth key point for the success of your analytical initiatives is to be able to easily put your findings into production.
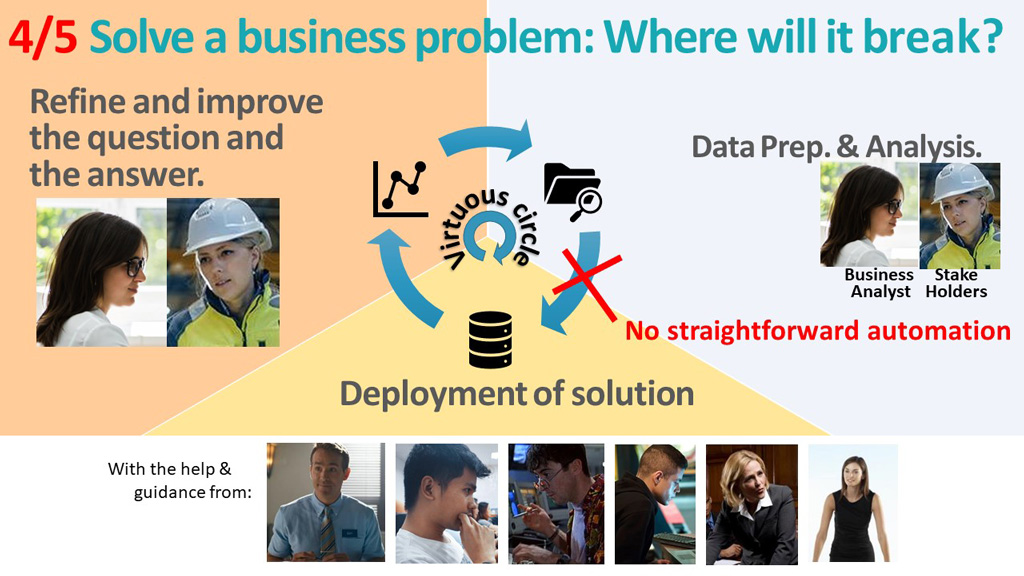
There are many reasons why the switch to production might fail. Here are the three most common source of failures:
- Instability of the software stack that you are using
This is especially true if you use tools developed in Java: those are particularly unstable. - Variable costs that quickly becomes prohibitive.
Often, you start with a prototype on a small subset of data, and then, when you go into production, you have to process all the data of the whole company, and then it just becomes too expensive. That’s the type of situation that happens all the time when you work in the cloud. - “In-memory” tool.
Another reason of failure is that you used a tool that only works well on a small amount of data and then completely crashes on a large amount. These are often “in-memory” type of tools that are limited in volume and end up continuously crashing.
5. A tool with no variable costs
The fifth and final key to the success of your analytical initiatives and the spread of the analytics culture in your company is to avoid any variable costs.
Indeed, let’s imagine that, for each iteration of this virtuous circle, you have to pay half a million euros in cloud fees to Amazon. In this situation, I can directly tell you that you’re not likely to do many iterations! 😉
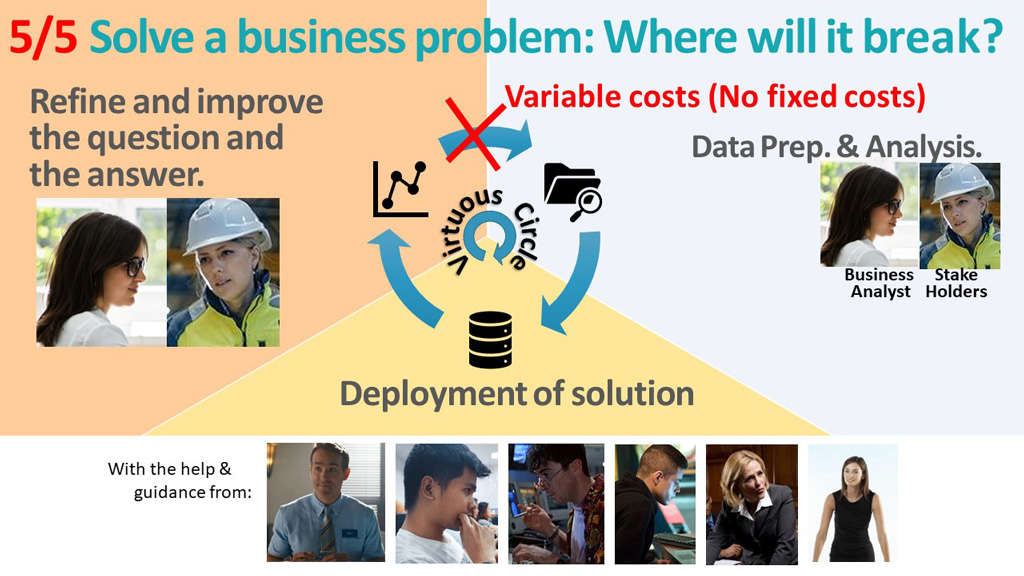
Another perverse effect of variable costs is to penalize and punish the most motivated data scientists of your team. Indeed, a young and enthusiastic data scientist who makes intensive use of your infrastructure to explore your data and get the most value out of it, well, this guy, he will cost much more than his colleagues, less motivated, who spend their time drinking coffee at the coffee machine. And, at the end of the month, the good motivated data scientist gets blamed by the CFO because of the high cloud costs he causes, especially compared to his colleagues. In short, a data science cloud tool that operates on a “variable cost” has the effect of penalizing, punishing, discouraging and ultimately preventing your best people from working.
Really, variable fees completely block any chance of success for your analytical initiatives.
That’s it! We have seen together the 5 key points necessary for the success of your analytical initiatives. Now that we know these 5 key points, we still have to see how to get them into your company.
The ultimate solution to create an Analytical Culture: Anatella
Strangely enough, there is currently only one data science solution that meets these 5 prerequisites.
And then you are surprised that ¾ of the analytical projects fail? 😅
That solution is Anatella. Anatella is the only solution that provides the 5 prerequisites required to create an Analytical Culture in your company. So, it’s very well to say that, but it’s even better to prove it. So, in the next slides, i’ll quickly give you some clues that will help you to make up your mind. Is Anatella really the only solution that provides the 5 key points that are required to have an Analytics culture?
Anatella allows your business experts to work in an iterative way and to easily do many iterations. In fact, Anatella has many other features that are necessary to adopt an iterative approach when working on analytical projects. If you want to know more, we have made 2 quite technical videos on the subject: they are in fact videos number 5 and number 6 of the basic training cycle to learn how to use Anatella.
In these same videos, you can also see that Anatella can be used entirely without typing a line of code, entirely in self-service.
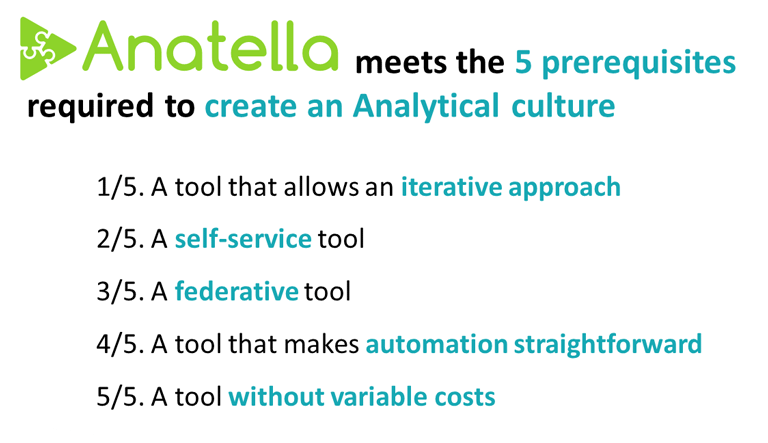
As for the federative aspect, in addition to a nice and user-friendly graphical interface, the tool must offer a system based on abstraction layers. In addition, the tool should not be a simple code generator because that imposes limitations that also prevent the federative aspect to “quick-in”. If you are interested, we have a page that covers the subject.
As for automation, it is something important but, in the end, it is not very complicated to achieve when you already have a tool like Anatella. A good integration with a well-known scheduler does the trick. We chose Jenkins as our scheduler because it is easily extensible, and already has hundreds of plugins to handle absolutely every possible scheduling situation.
You can see here and here some videos that show the integration between Anatella and Jenkins. In short, with just 4 mouse clicks, you can put an Anatella process into production in Jenkins. Automation with Anatella is really easy!
As for the operating costs of an Anatella-based system, they are very low, mainly because a very small hardware infrastructure is capable of absorbing almost any computational load and any volume. As a result, you can expect to have almost constant hardware infrastructure costs, with no variable part. And the license fees for TIMi and Anatella are also constant and independent of the volume processed. So you can rest assured: no variable costs!
The fastest solution on the market
In addition to the 5 prerequisites we have just seen, Anatella is also the fastest and the most scalable data preparation solution on the market. Technically, Anatella is more than 20 years ahead of absolutely all its competitors (if ever the competitors manage to catch up, which is still unlikely!)
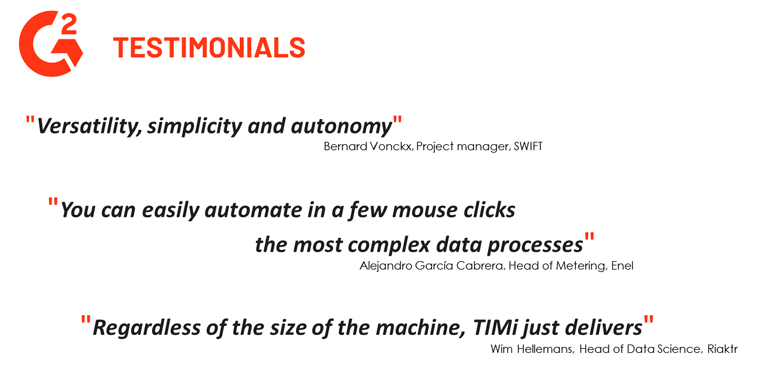
So, if you are serious about your data initiatives, if you want to ensure that your efforts and investments in manpower and time are well used: There is one solution: Anatella. The different testimonials you’ll find on G2 show that all this is real. To tell you the truth, TIMi has the highest satisfaction rate of any data science solution on G2.
See your analytical projects succeed
At TIMi, we are driven by one value in particular: ethics. And with that in mind, before any profit, we want to see your analytical projects succeed.
As each company approaches analytics in a different way, your free trial period with TIMi is flexible, to fit your way of working. Generally, 2 months is enough to understand all that a great analytical tool like TIMi can offer you. In addition, you will receive tailor-made support for TIMi&Anatella, until you have demonstrated, with your first success, the unquestionable value of your successful analytic initiatives within your company.
All you have to do now is to make the little step and join the hundreds of dynamic companies innovating through analytics with TIMi!
And to make the step, it’s simple, you click on Download TIMi and then click on the big blue button in the middle of the page. There is an automatic wizard that will install TIMi and, after a few minutes, you can start playing with your data.

