Reporting & OLAP
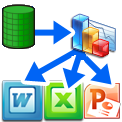
 Anatella is fully integrated with the MS-Office Suite. In a few mouse clicks, Anatella can read, write or update MS-Excel .xlsx files at very high speed (using its own proprietary code). Anatella allows you to automatically update all the charts and graphs of all your MS Office reports (without using any un-maintainable VBA scripts!). For example, Anatella can automatically update the charts in your Powerpoint report, for easy reporting to your C-Level.
MS Office charts generation
A reporting technology based on MS-Office is great because everybody is able to use MSOffice!
This is why we added inside Anatella a special operator that allows you to automatically update all the charts and graphs of all your MS Office reports.
We are combining:
- Simplicity and universality of MS Office.
- An automation mechanism that ensures that all your MS Office reports will keep updating and being produced each week, even if you upgrade MS Office (Actually you don’t even need MS Office installed on the Anatella server to create the required MS Office reports: the technique used inside Anatella is totally independent of MSOffice or VBA).
Anatella is able to generate any kind of charts available inside the MS Office suite. You have full control of all the settings of all the charts. For example, you can obtain, in a few mouse clicks, each day, an automatic update of all the charts of your preferred PowerPoint presentation.
Quantifiable ROI
Dashboards and Reports are efficient tools to track all your activities and they are an important part of the daily life of most companies.
However, the efficiency of such tools is quite limited compared to other approaches based on predictive/advanced analytics. Indeed, the most efficient and the easiest way to improve your performances and KPI’s very often lies in a good predictive model.
We sincerely believe that the largest ROI that you can extract out of your data originates from predictive models (such as the ones created with TIMi). Despite their importance, the reporting and dashboarding activities are just “fixed costs” that you need to reduce to the minimum, since it (usually) doesn’t provide any quantifiable ROI. Using the reporting facilities included in Anatella, you can automate the creation of all your MS-Office reports in a few minute, and at a very low cost. Furthermore, since everybody already know how to use a PowerPoint report or an Excel report, you don’t even need to train anybody, still reducing costs.
Integration with leading BI Solutions
The creation of MS-Office reports very often represents only the first step towards a complete and through full reporting/dashboarding solution.
This is why Anatella offers a direct and native Integration with all leading third-party BI solutions such as Qlik, Tableau, Kibana.
But, maybe the best BI solution is the one directly integrated inside TIMi: Kibella.
Read More about BI Integration
Read More about Kibella
