MEDIA MIX OPTIMIZATION
FOR MEDIA BUYERS
The objective is to create a predictive model that is able to predict the efficiency of different investments made in various medias. Then, we use this predictive model to make different simulations of different investments “mix”. Finally, we chose, always using the simulator, the “media mix” that yields the maximum efficiency.
The media considered are:
- Investments in TV time
- Investments in Radio time
- Investments in Billboards display
- Investments on the Point-Of-Sales
- Online Investments in SEO: buying keywords
- Online Investments: buying displays inside banners
- Online Investments: buying clicks and paying them “per click”
- Online Investments: buying clicks and paying them “per conversion”
These kind of predictive models also contains some extrageneous variables such as:
- Temperature
- Humidity
- How many schooldays in the week/month?
- GDP of the country
- % of unemployment in the country
The Cofidis case
Let’s give an example on the Codifis case. Cofidis is a financial institution specialized in lending short credits. The exact objective here is to predict the NLR: Number of Loan Requests.
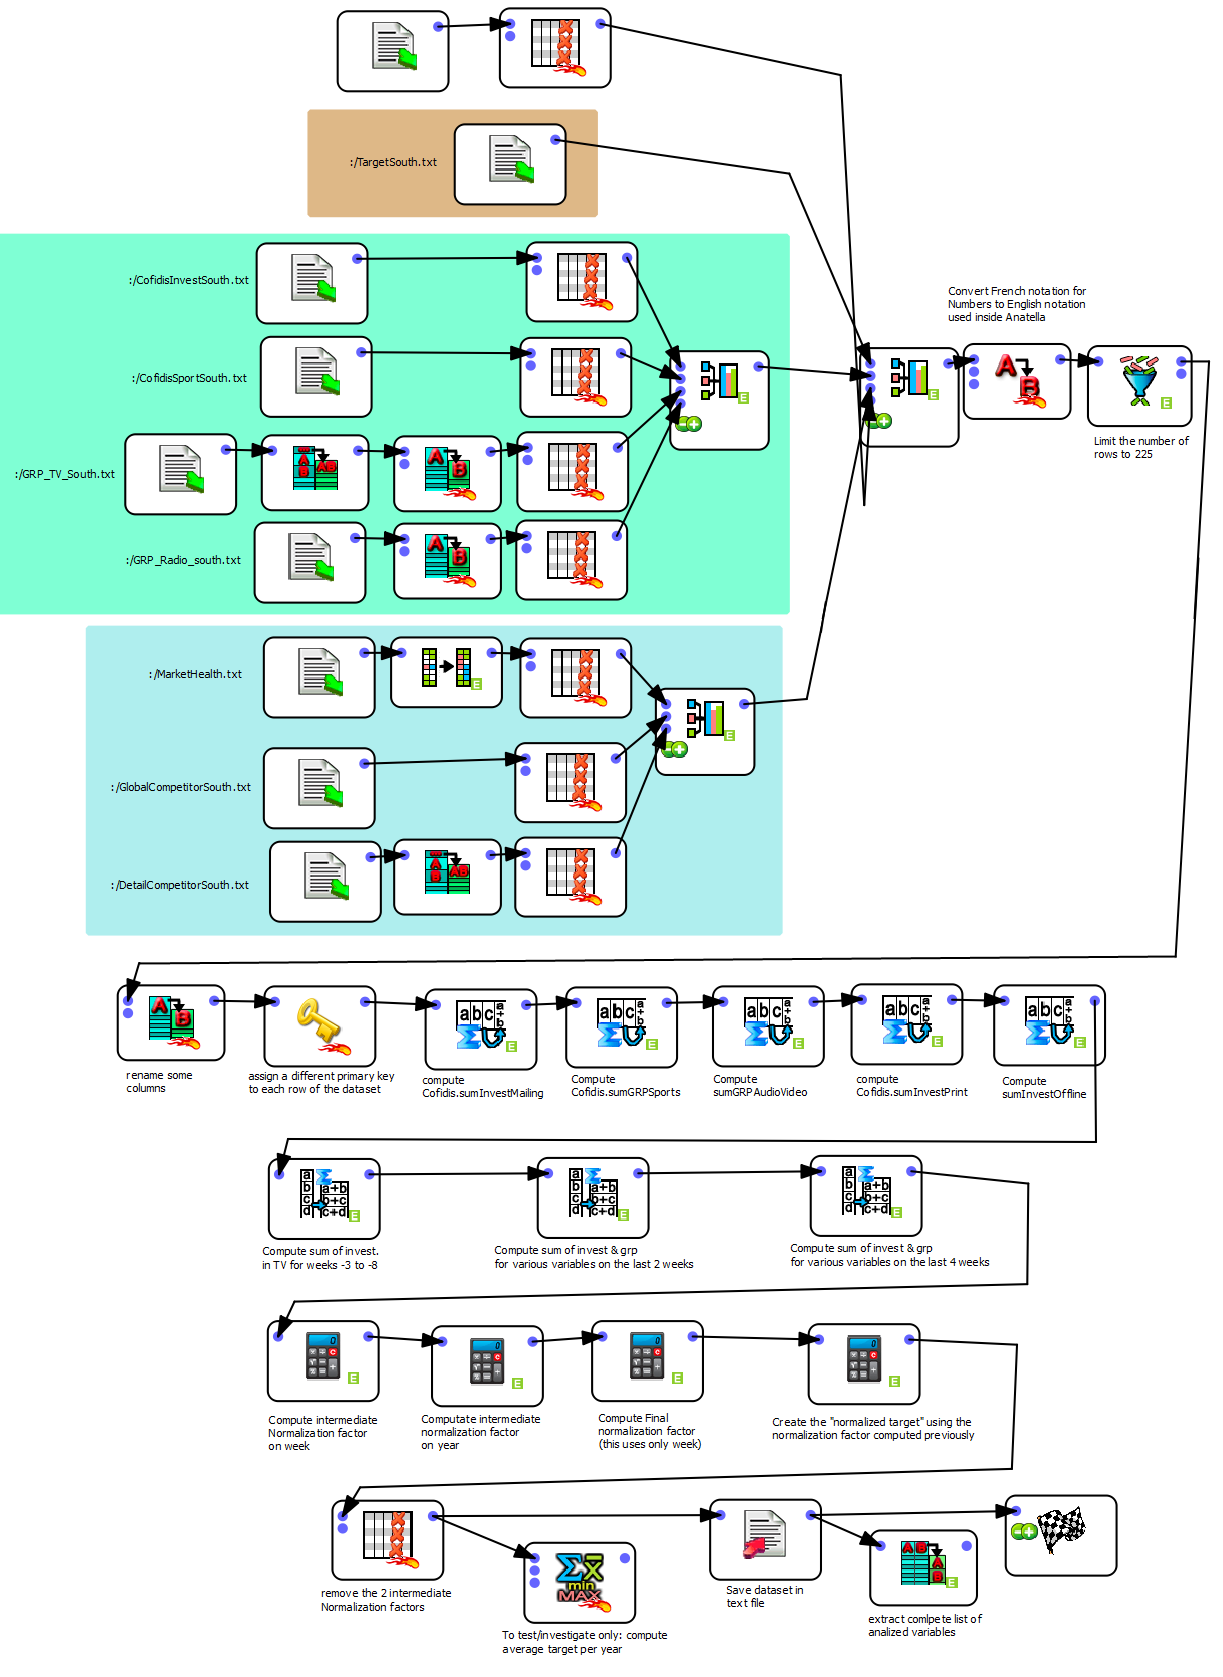
Data transformation
Here is a screenshot of the data transformation required to create the predictive models with Anatella.
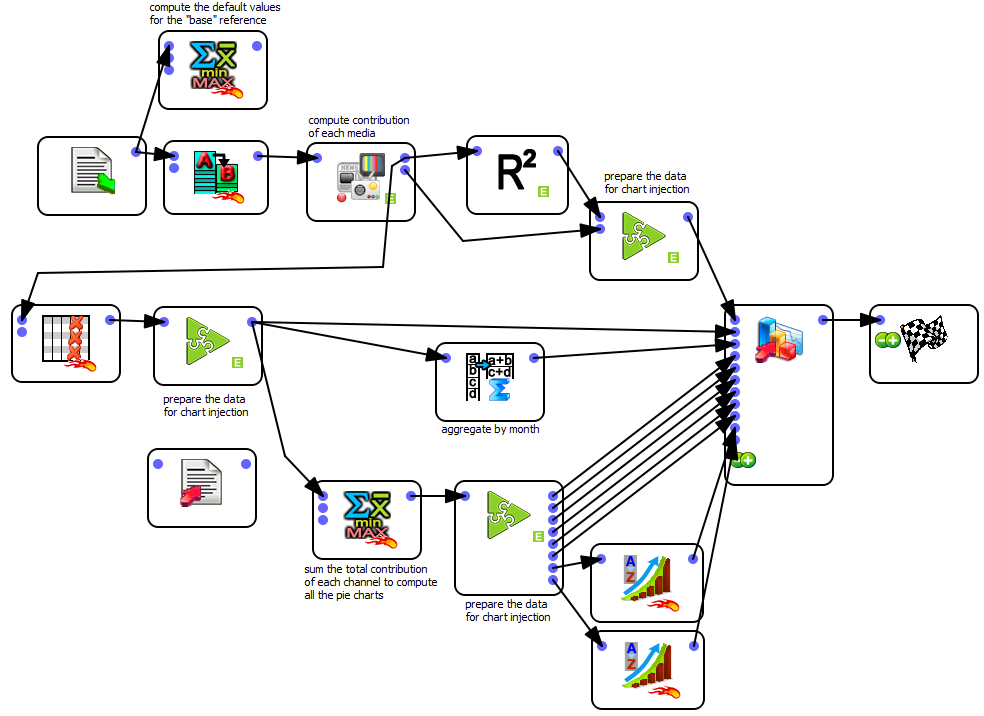
Automatic reporting
Once you have a model, Anatella automatically create a powerpoint report based on the results of the predictive models.
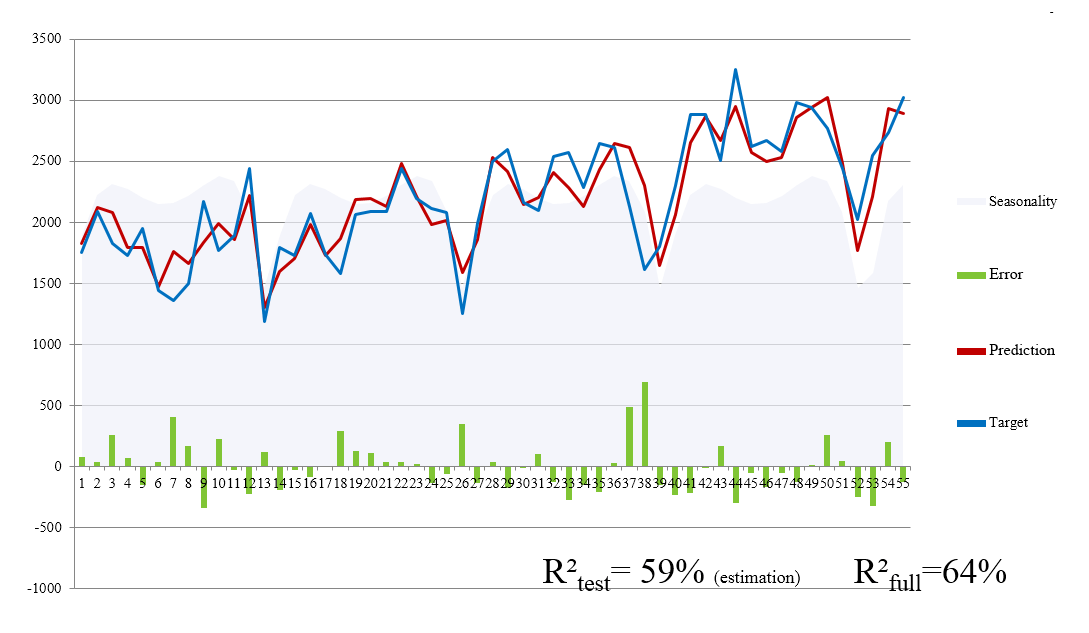
Some results
Here are some results generated by Anatella based on the above data-transformation. The second chart explains the effect of each group of variables inside the model. The variables are grouped into 3 themes: the external drivers such as temperature, humidity, etc (in green); the investments in ads from competitors (in grey), your own investments in ads (in red). The blue layer is the base: it’s the recurrent quantity of sales if there is is no investments in ads from anybody.
Real NLR vs Predictions
Advertisement effects
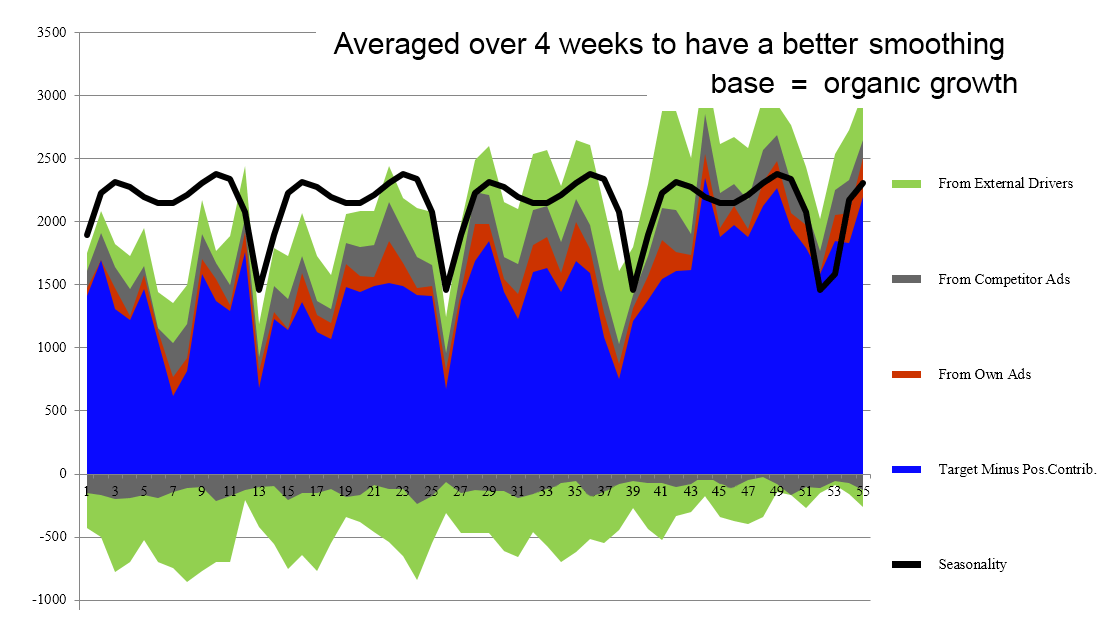
More insights
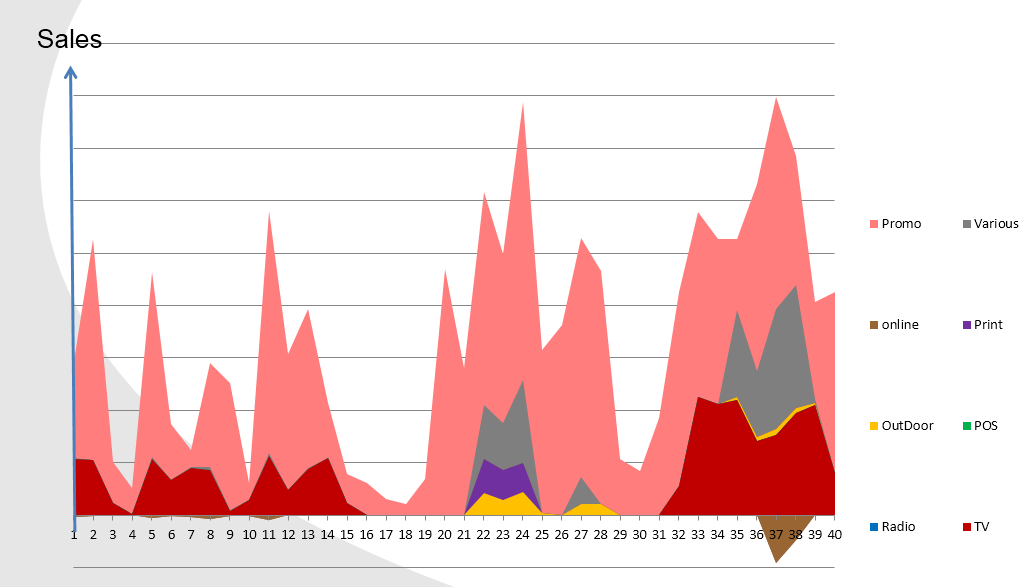
The first graph hereunder gives you have an idea on the contribution of each group/theme of variables. You can also “zoom-in” and display the effect of the variables that are only inside the theme “Variables describing investments in ads from competitors”. You can see that, amongst your own investments, the investment that is working the best is “Promo”: in the case of Cofidis, the “Promo” are actually the investments to have “cofidis” banner during sport events: indeed Cofidis is sponsoring The “Codifis Cup”: a very popular football cup in Belgium and The “Cofidis Team” the famous bike team.
Global advertisement effects
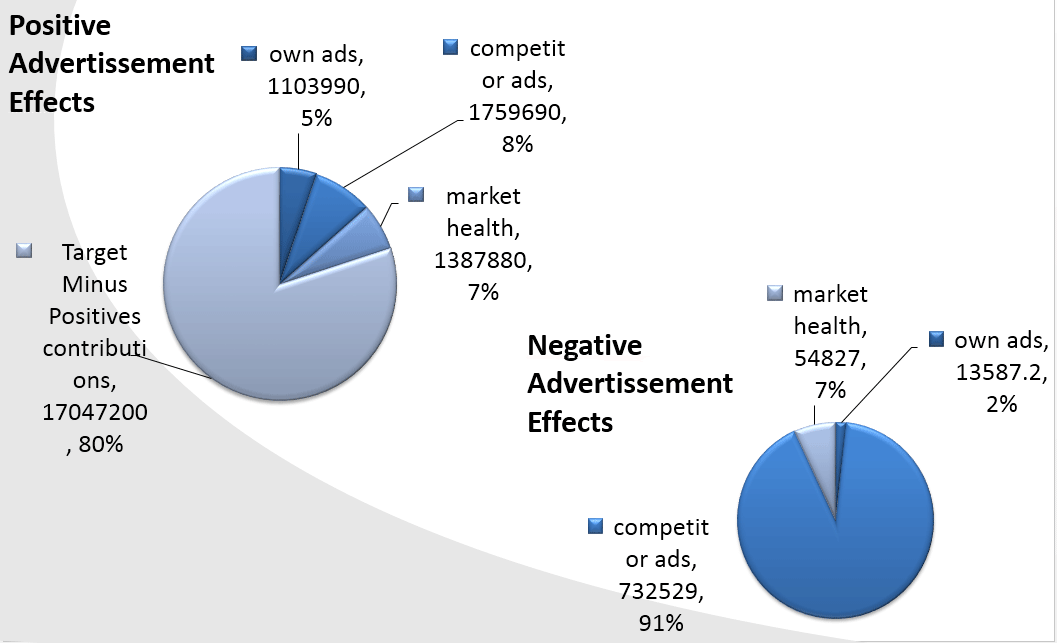
Own advertisement effects
BANKING CUSTOMERS

Cofidis

BVBA Continental

Scotiabank

Axa

Crelan

Inversiones La Cruz
Euroclear

ING

Beobank

Mornese

Credinka