GRAPH MINING
Anatella is able to run SNA (Social Network Analytics) and Graph Mining algorithms on the very large graphs available inside the telecom & banking companies. With Anatella, you can use Graph Mining algorithms, detect Communities, detect Social Leaders, compute Graph kernels, etc. on graphs with several dozens millions of nodes and several billions of arc.
The Telecom PREPAID CASE
Many telecoms in Africa are equipped with TIMi and Anatella through our partnership with Riaktr (ex Real Impact Analytics). With prepaid products, you don’t have any information about your customers: you don’t know their address, their age, nothing. The only thing that you can observe is the “graph of communication”.
- One node of the graph is one phone number
- An arc between two nodes is a phone call between two phone numbers.
- One node of the graph is one bank account
- An arc between two nodes represents the fact that 2 customers are buying some items (bread, liquor, small electronics, etc.) insde the same store.
Generating 2000 variables
- Inside your group of friend, what’s the number of recent churners?
- What’s the probability to have a Multi-SIM handset? How much phone call (how many procent) are done using the “other SIM”?
- What’s the social leader of the group? (important for “refer-a-friend”, viral marketing campaigns)
We are able to compute such very complex SNA variables on very large graphs. We can process graphs with more than one hundred millions subscribers in it.
One unique ability of Anatella is to quickly detect communities in large graphs. The problem of “community detection” is special because, for such problem, you cannot use “sampling techniques” to reduce the quantity of data because, when you “sample” your data you are actually removing (randomly) arcs out of your graph and the algorithm is not able to find the right communities anymore on this “broken” graph.
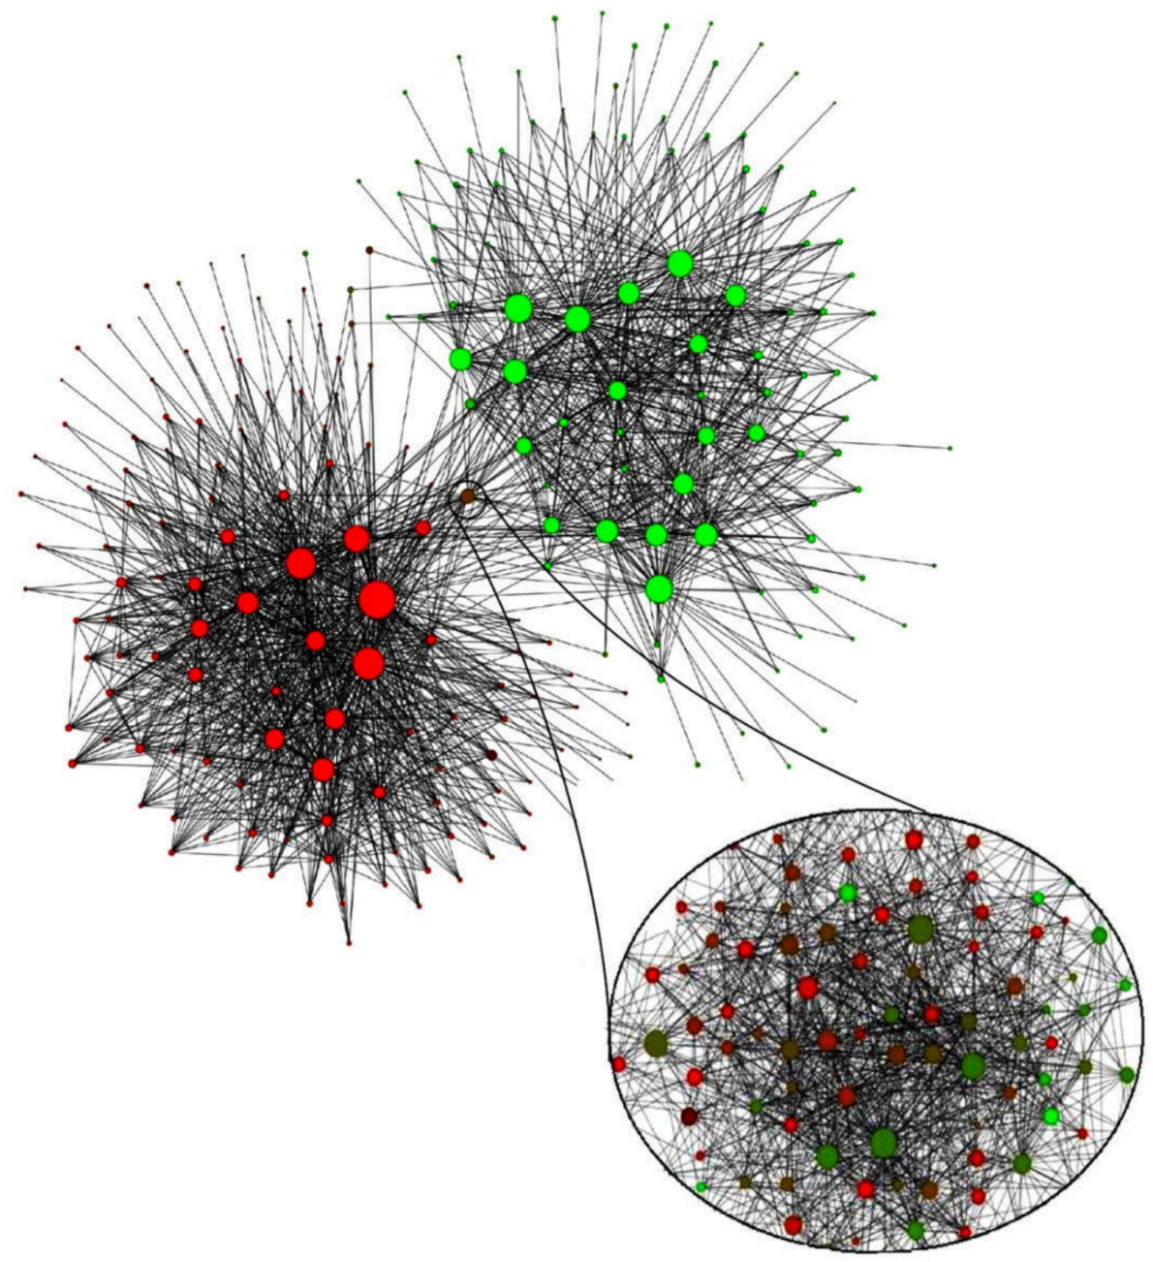
One amusing fact, you can compute the communities on a graph where each node of the graph is already a community (and not a simple phone number). Inside Anatella, this is called “Community Level 2” (i.e. communities of communities). On the graph based on mobile phone communication between individuals from Belgium, when we continue to create communities of community, we finally arrive to:
In the illustration hereby, each dot is a community (the size of the dot is the size of the community). The color of the dot represents the language spoken in the community on a red-green scale (red for French; green for Dutch). The community detection algorithm perfectly retrieved the French Speaking and the Dutch Speaking communities (with a third community “in the middle” that is Brussels that is bilingual).
BANKING CUSTOMERS

Cofidis

BVBA Continental

Scotiabank
Axa
Crelan
Inversiones La Cruz
Euroclear

ING

Beobank

Mornese
Credinka