When asked about analytics roadmap, we usually diverge the conversation towards another concept: how embedded is data in your corporate culture, or how mature are you in terms of data culture?
When it comes to analytics, in our point of view, the goal should be to have self service analytics. This means reach a point at which data is really a commodity used confidently at any level of the organization. Everyone can access, create KPI, aggregate data, all from a single trusted source that feeds BI tools, predictive analytics initiatives and regular queries by business people. Predictive analytics also works as a service. Business people commonly use automated predictive models to understand the drivers of some events.
The natural question is: “how do we get there?”. And what are the other organizational level of data culture?
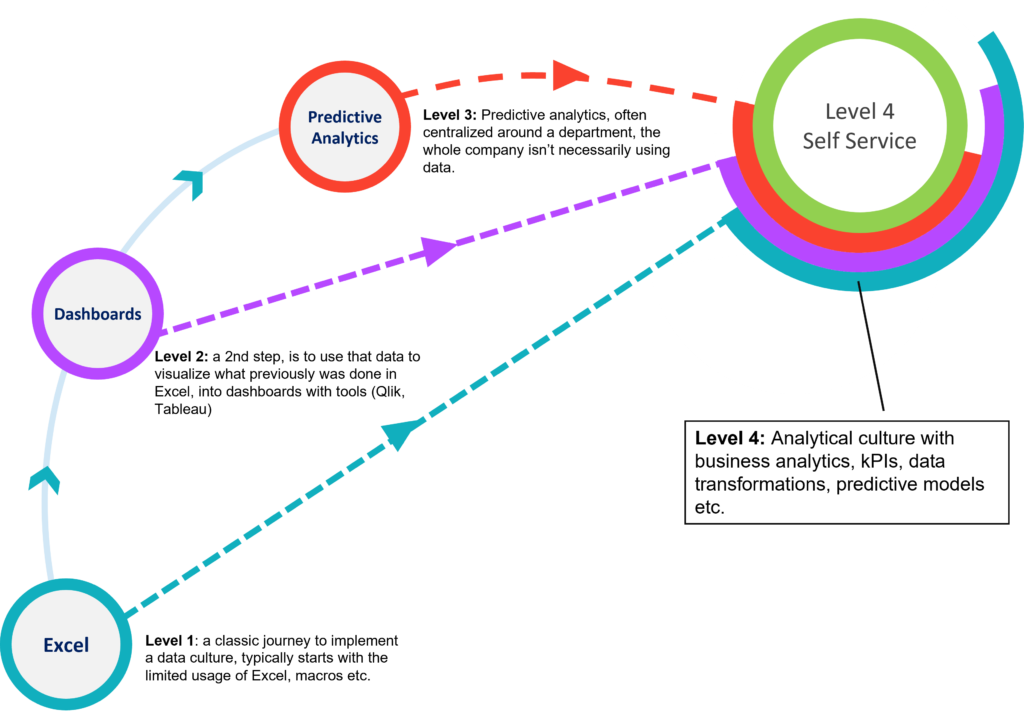
The Four Levels of Data Culture
After a lot of thinking and internal conversations, we reached a consensus where there are four points in data maturity / data culture to focus on:
- Excel: this is where most organizations start. Naturally, I would say. Data analytics is in silo, there are no functions articulated for data or information. Each department performs their own analysis and it is very difficult for management to have a view on anything. IT is – with reason! – protective of its data: queries are always a disruption and, in general, analytics seems like overwhelming task.
- Dashboards: At this stage, organizations have gained a lot of maturity in centralizing and using the information. But there are many obstacles along the way: the data warehouse is slow to update, any change in the processes is problematic. Some dashboards are not updated at the same time as others and we still have multiple versions of the truth.
- Predictive Analytics: This is where organizations believe they have reached maturity, and often enter the danger zone. There is usually a data science department that controls all processes related to predictive modeling. In some cases there is also a BI department or even an architecture department where they get “the data ready” for data scientists. And this is sometimes taking organizations very far away from being really Self Service, as it adds bottlenecks between decision makers and data.
- Self Service: Data is at the core of corporate culture, and decisions are based on information at every level. The user of the data is the owner of the process: citizen data scientists are spread all around the organization. It is common for executives to play with data without requiring a team of data scientists.

The key element of this “maturity road” is that it is completely non-linear: you don’t need to go through each step to become a self service analytics organization. On the contrary: as you jump to “level 4”, all other levels will naturally enable themselves.
A Typical Journey
The most natural way to start is the adoption of Excel Spreadsheets and basic databases.
- There is an IT function (or person) responsible for transactional databases.
- Analysts have freedom to develop their spreadsheets
- Finance, HR, and Marketing rely heavily on those spreadsheets
- Somehow, they seem to have different data. It is hard to come up with coherent KPIs.
The first steps
The first challenge is to make sure we have a single version of the truth. To do this, we automatically extract all the data for Excel. We promote the use of Excel as a final layer, not a data integration layer!
There is immediately a nice side-effect: the database runs smoothly! Analysts work from a NAS, reading normal files, instead of querying the database server. Without interruptions from business queries, the IT group has more time to think: they organize the data better, and focuses on its core responsabilities.
Quickly, you will realize that most users need the same KPI that you send directly into the data lake. As anatella scripts tend to appear everywhere, a new unit emerges to take control of the key processes. IT usually takes control of all accesses to the DB , cleans up and organizes the main data lakes. Users are trained to work with anatella in a “invent on your desktop, deploy on the server” kind of approach. Processes are shared.
Dashboards start to pop up
ETLs take a life of their own and become very dynamic. Departments add new processes and generate their own “datamarts”. And all of a sudden, you will see that this data is EXACTLY what dashboards need to show. Except that there will be no extra ETL needed: all you’ll need to do is add an extra “export” box at the end of you existing ETL, and your BI tool will receive, in real time, all the data it needs. As many departments typically have already started to play around, you decide to implement Qlik, Tableau, PowerBI, Kibella, or other (anatella has native connectors for all of them). BI Tools provide new ways of doing analytics, more visual, more standardized, and this give the organization a much broader analytics capability.
Predictive Analytics popped up, too.
While doing this process, in some departments, analysts will already have started to use the data in algorithms for auditing or predictive needs. Note that nobody had to wait for dashboards to be there. The only requirement was a trustworthy source of information, and the promise not to interrupt operations.
After a few iterations, they put those models into production, and they run automatically as soon as the data lake is updated. And it will already send its results to the database that feeds information to your BI tools. Predictive Analytics datalakes are completely different animals, but business stakeholders quickly realize they too can use them to specify filters and target and get insights on the drivers of specific business situations. Predictive analytics now fulfills different needs: the traditional marketing automation, demand planning, financial planning and risk management, but also as a customer insight and anomaly insight exploration system.
The Move to Self Service
At the moment you adopted anatella, you had self service analytics for some power users. As you grow in maturity, you empower more business analysts to play with the data. As they no longer even touch the production database, there can be no negative impacts on systems, and they quickly realize they have similar needs as their colleagues in other departments. They develop processes that become nodes, shared on a central platform. As they pose no threat to the data integrity, and there is no variable cost associated with the use of information, the organization wants data scientists to dig into the data as much as they can.
And one day, you find yourself in a board of directors meeting and the CFO and CMO pop up TIMi Modeler to run a quick predictive analysis using the absolute latest data to make a decision… and you realize you are way above where you expected to be today. This is the magic of being a data driven organization!


