Comparison of segmentation and prediction-based techniques
In a classical lift-curve, the unit of the X-horizontal-axis is traditionally in percent: it’s the percentage of the population selected. Also, in a classical lift-curve, the unit of the Y-vertical-axis is traditionally also in percent: it’s the percentage of the buyers found.
Let’s plot the 2 lift curves (the one obtained from the segmentation and the one obtained from the predictive model) on the same chart (the X and Y axis are now in percent):

In the above chart, there is a yellow line: This yellow line represents the “random selection”: For example, if you select randomly 50% of your population, you will “find” 50% of your buyers, thus the yellow line goes through the coordinate (50%; 50%). The “random selection line” represents the worst selection/ranking that you can do (i.e. it’s a pure random selection).
In the above chart, the lift that characterizes the ranking obtained through predictive analytics (the red one) is higher than the one obtained with the segmentation technique (the blue one). This is always the case. What does it means?
- Predictive techniques creates better rankings than segmentation techniques: On this example the ranking obtain through predictive analytics will typically generate 20% more cash than the ranking obtained through segmentation technique.
- The predictive model is able to extract out of your database the “right people”: The predictive model exactly “extracted” the right people: i.e. the ones that are interested in buying your product (and very few other people).
- Depending on the context, a difference between 2 rankings that is as small as 2 or 3 percent on the lift could mean millions of euros (or dollars) of difference between the corresponding marketing campaign. This is especially true in the banking, telecommunication and insurance world. In these fields, a few added percent on the lift curve directly translate to hundred thousands of added ROI for your marketing campaigns. You NEED to have the best lift. Otherwise, you are losing money at each marketing action.
The lift obtained with TIMi are systematically better than the lift obtained with any other commercially available analytical CRM software (it’s very common to have an improvement from 5% to 20% at X=10%) (i.e. it’s very common to have an added ROI of 5% to 20% when using TIMi, compared to other tool analytical CRM tool).
Why are there so many people still using segmentation techniques to create their ranking?
The answer is:
- Creating a predictive model used to be extremely difficult: Very often, you had to hire expensive “specialized consultants” during 2 or 3 months to obtain a medium-accuracy predictive model. With TIMi, anybody with an analytic mind can create extremely accurate rankings/lifts in a few mouse clicks, in a few minutes. This is a revolution.
- Standard “predictive software” (such as SAS, SPSS…) have enormous difficulties analyzing large databases. They run for hours without giving any results. Whatever the size of your database, TIMi always gives an extremely accurate ranking in a few minutes.
- Usually, software that are able to create correct predictive models are (very!) expensive. To have the same functionalities as the “basic TIMi package”, it’s very common to pay between 170.000 and 940.000 euros per computer the first year (and it’s common practice to pay one third of the initial buying price each year, as “support” costs). TIMi has zero up-front cost. This means that you don’t have to pay between 170.000 and 940.000 euros per computer to acquire TIMi the first year. When using TIMi, you only pay the “support costs”. The TIMi support costs are usually 1/3 (one third) of the price of an equivalent “mainstream” solution. Furthermore, TIMi is 100% free for education (e.g. for marketing departments in universities) and charity work. This is a revolution.
- To create correct predictive models with other tools, you need first to “clean” our databases to remove all errors (like “negative values” in the “customer’s age” column). This process is usually extremely time-consuming (and expensive) and thus people generally avoid using predictive modelling. In opposition, TIMi completely remove the need for “cleaning” and allows you to directly analyze “RAW data”. TIMi can directly connect to your operational system and instantaneously give you many highly accurate rankings & lifts. This is a revolution!
Differences in results between the “Advanced Analytics” tools
- Tools based on Prediction techniques (such as TIMi):
These tools have a higher ROI (usually ten times higher than segmentation based tools). TIMi delivers the highest ROI of all “Predictive Anlytics” tools. Usually, predictive Analytic tools have a higher price tag (but not TIMi). - Tools based Segmentation techniques:
These tools have a very low ROI compared to Prediction-based tools. The tools based on segmentation techniques are usually marginally cheaper (but not always).
Here are some lift curves (automatically generated with TIMi) that illustrate the quality of different rankings:
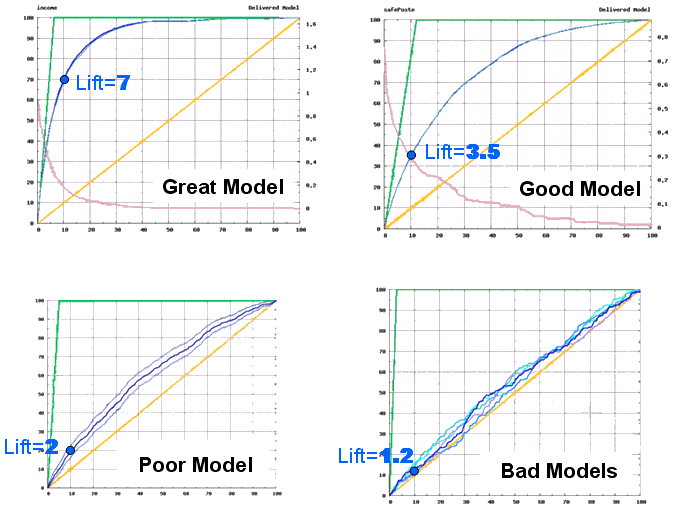 The lifts obtained with TIMi are systematically better (they are higher) than the lifts obtained with any other commercially available “Advanced Analytics” tool. This fact is demonstrated by our outstanding results at various datamining competitions and various industrial benchmarks. This means that, when you are using TIMi, all your marketing campaigns will have substantially higher ROI (from 10% to 20% added ROI compared to another Predictive-Analytical-CRM-Tool (and from 300% to 500% more ROI compared to a segmentation-based-Analytical-CRM-tool).
These differences in ROI between the different “Predictive Analytics” tools are somewhat difficult to understand when you are used to other kind of software. Let’s take an example: If you run a SQL script on the same database using two different RDBMS engine (e.g. using an “Oracle” engine and using a “Teradata” engine), you’ll get exactly the same answser. The same is not true for “Predictive Analytics” tools: For example: Let’s assume that you used the exact same dataset to create a ranking with TIMi, with SAS, with SPSS, with R, etc. Each “Predictive Analytic” tool gives you a different ranking (and thus a different ROI)(…Although we used the exact same data to create all these rankings!).
Thus, the process of selecting the right “Predictive Analytic” software is different than for other “normal” tools (such as an ETL tool, a datawarehouse tool, a OLAP tools, etc.). With “normal” tools, you are mostly interested in the number of functionnalities because there are no differences in the end-results. In opposition, all predictive Analytics have, more or less, the same fonctionnality. Thus, to select a good “Predictive Analytics” tool, you should rather be interested in the quality of the results (i.e. you should be interested in the ROI that you can get from the tool). (See this page about how to compare precisely the ROI of different predictive models).
Summary
HIGHER LIFT CURVE = HIGHER ACCURACY = HIGHER ROI