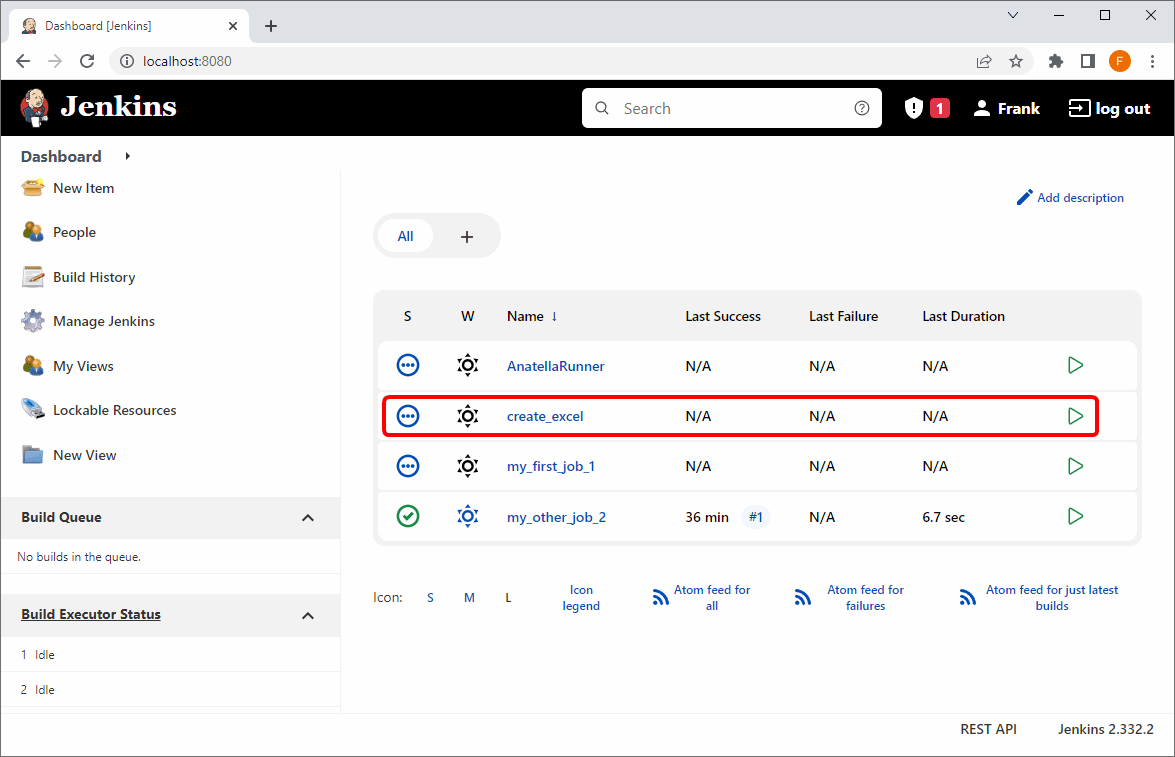
Once an Anatella graph is added inside Jenkins it appears inside the Jenkins web interface: For example, in the example from the section 4.8.4. here above, we just finished adding into Jenkins the Anatella graph named “create_excel”. It’s now visible here:
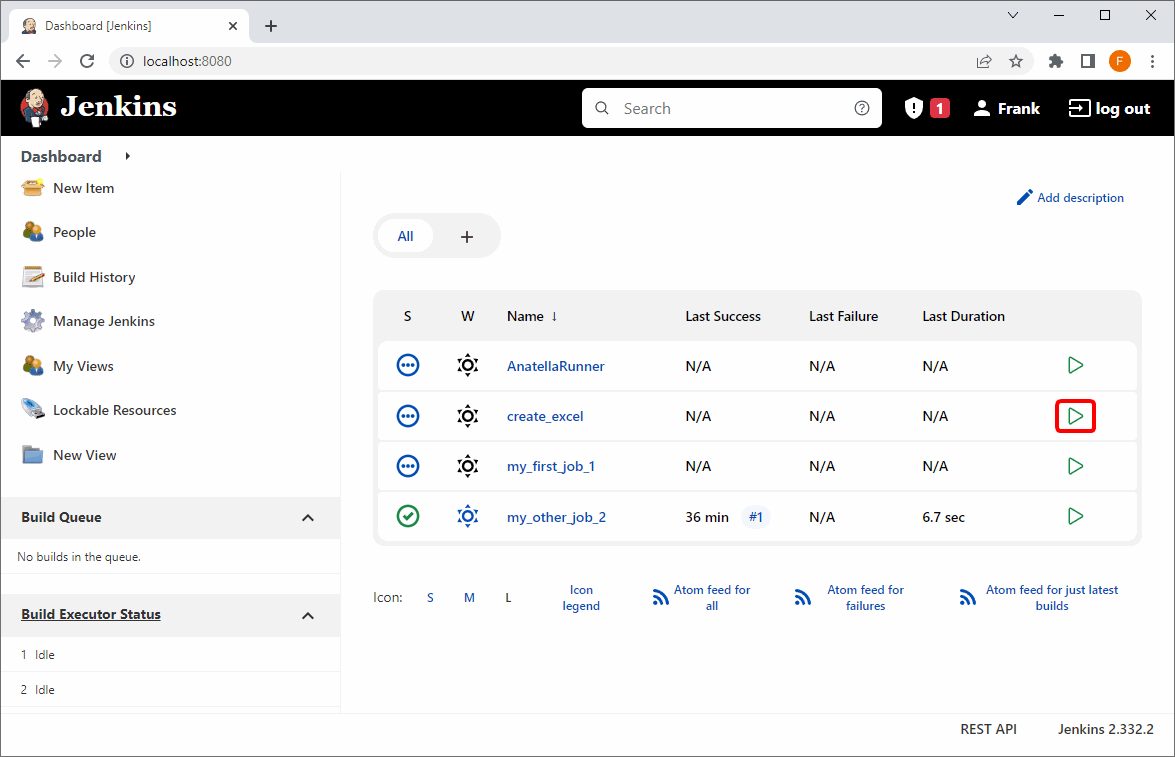
At this point, no need to wait for Jenkins to run the graph: We can execute it directly by clicking here: on the ![]() icon.
icon.
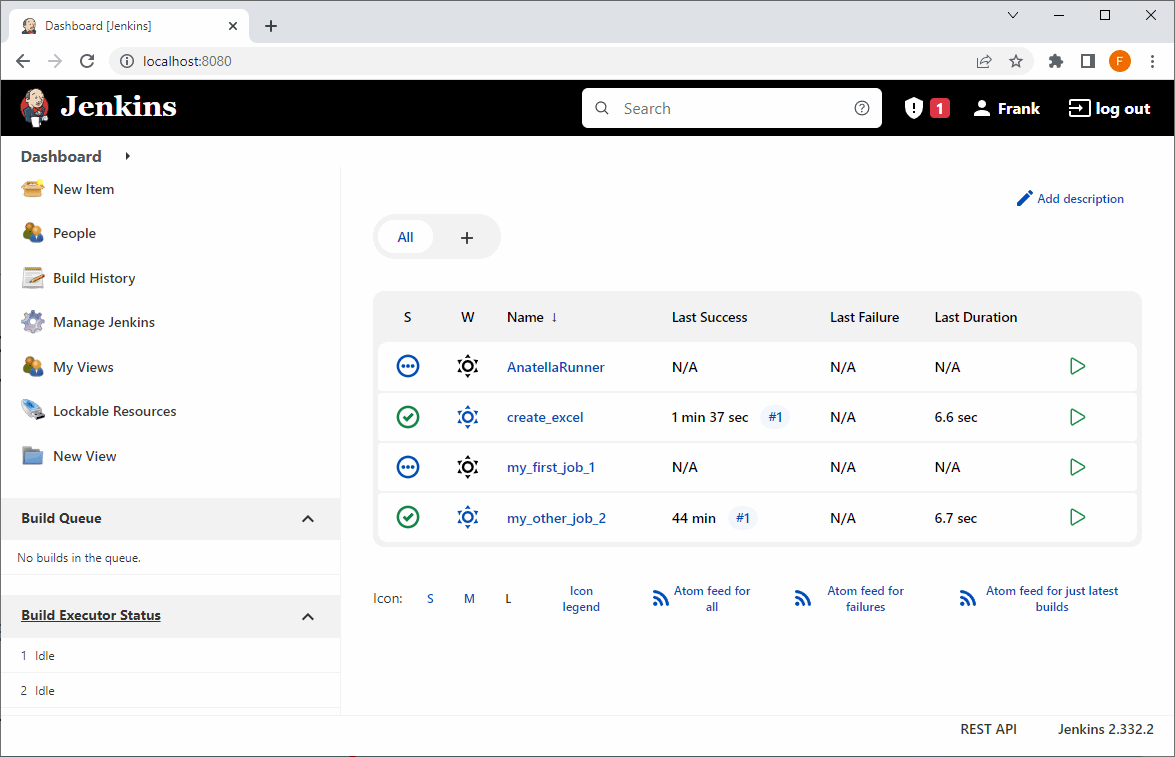
After a few seconds, refresh the webpage (press F5 or click the ![]() refresh button in your internet browser): You should see:
refresh button in your internet browser): You should see:
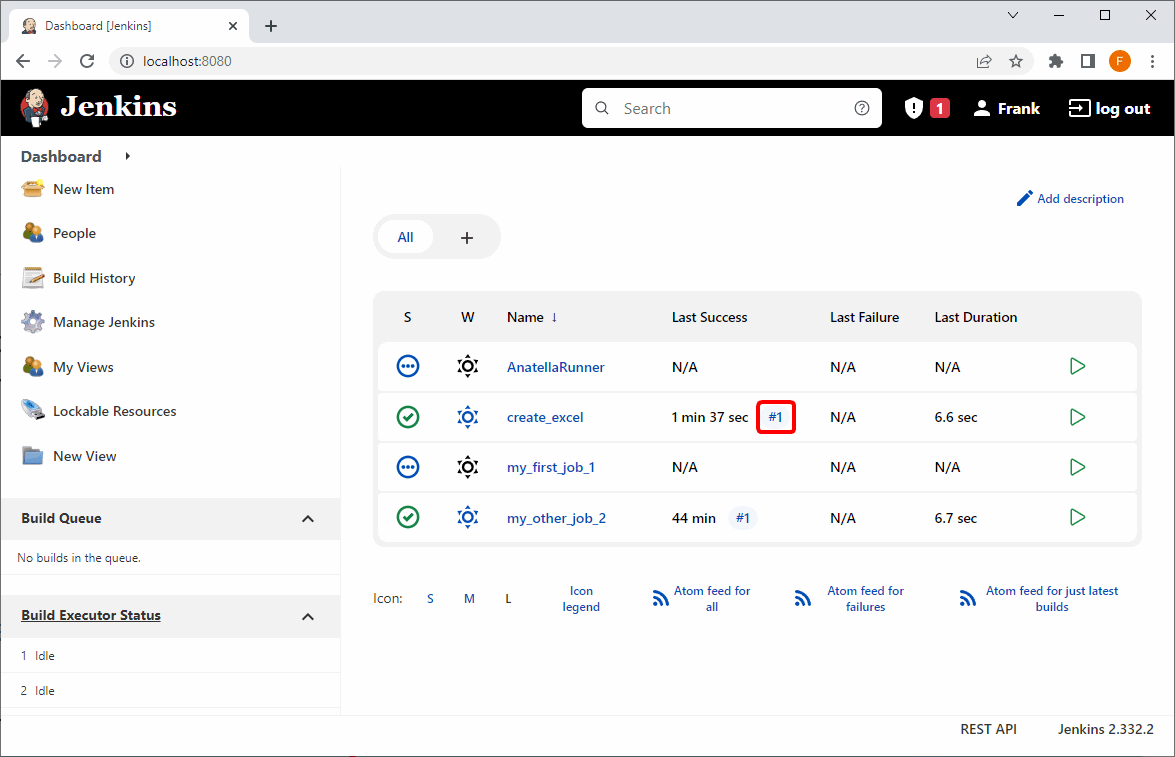
To see the content of the Anatella log window, click here:
..and then click here:
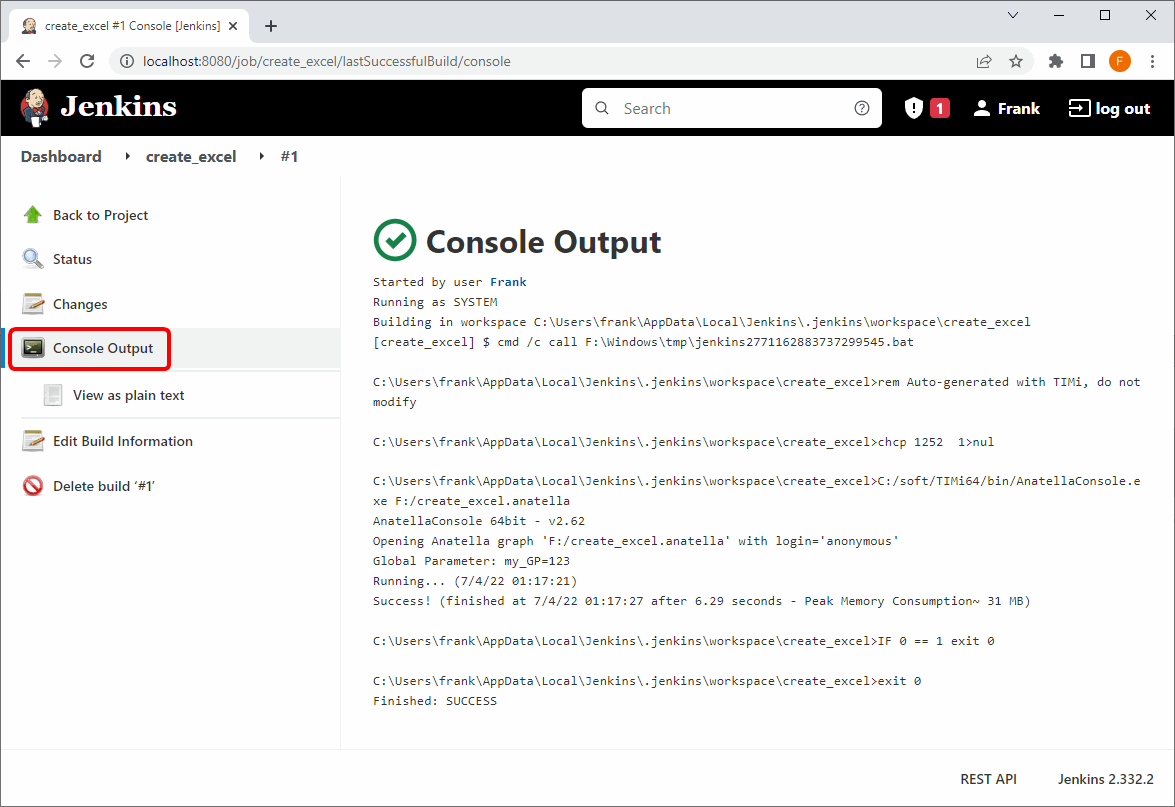
The content of the Anatella log window is here: .
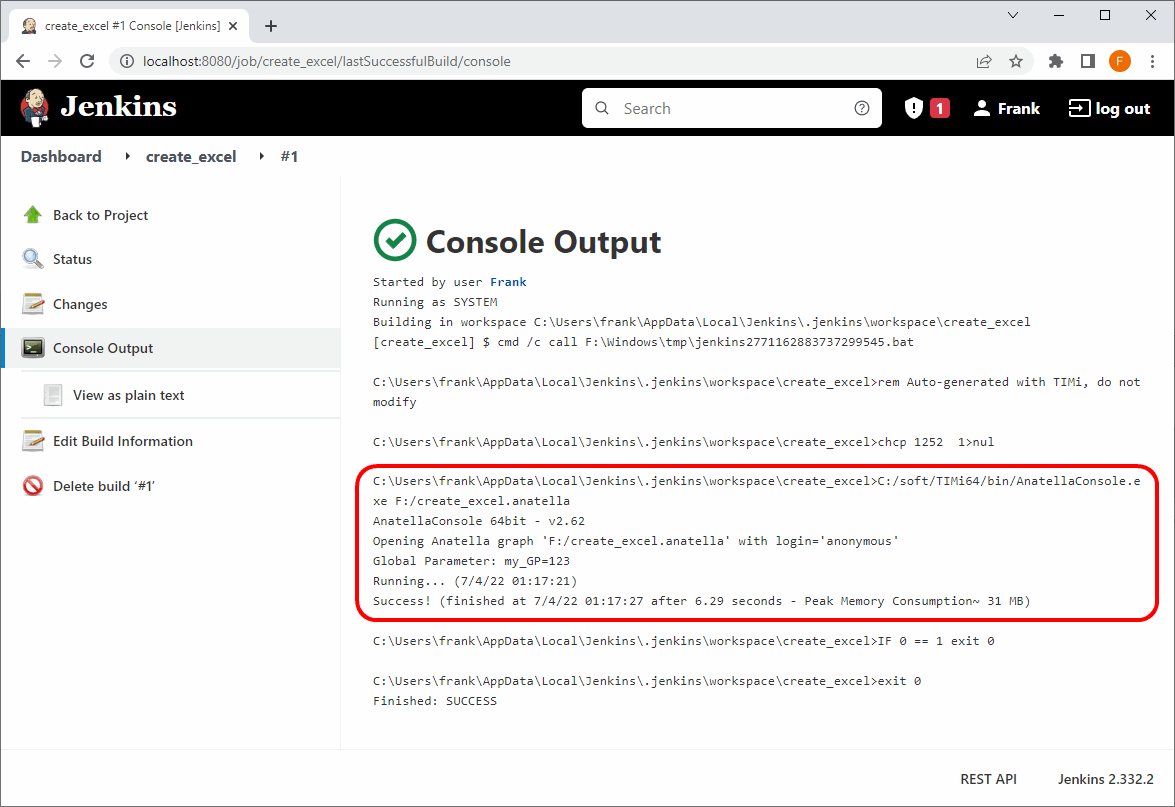
Check this log to see:
•.. if your graphs worked as expected.
•.. easily find & fix any errors in your graphs.