Currently, only the axises associated with continuous variables can be displayed (and only when the 3 axises used for display as defined in section 5.3.1.1. are “PCA” axises).
For more information on how the “original axis” of the dataset are projected inside the reduced spaced, please refer to section 2.2.5.
Using the “Axis” table, you can:
•show/hide an axis.
•change the size and position of the axis label.
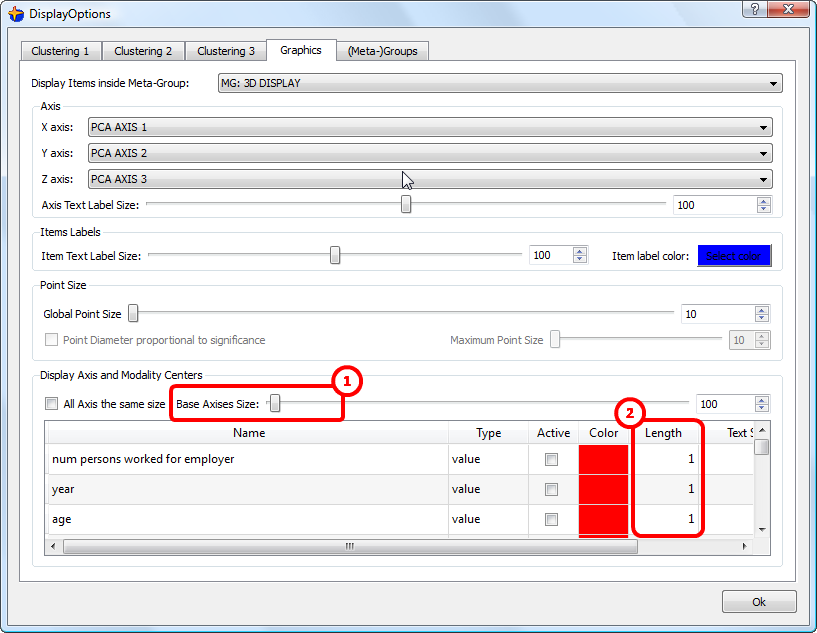
•change the length of the vectors representing an original axis. To do that, you have a global “length-control” here: ![]() ... and a “per-axis” control here:
... and a “per-axis” control here: ![]()