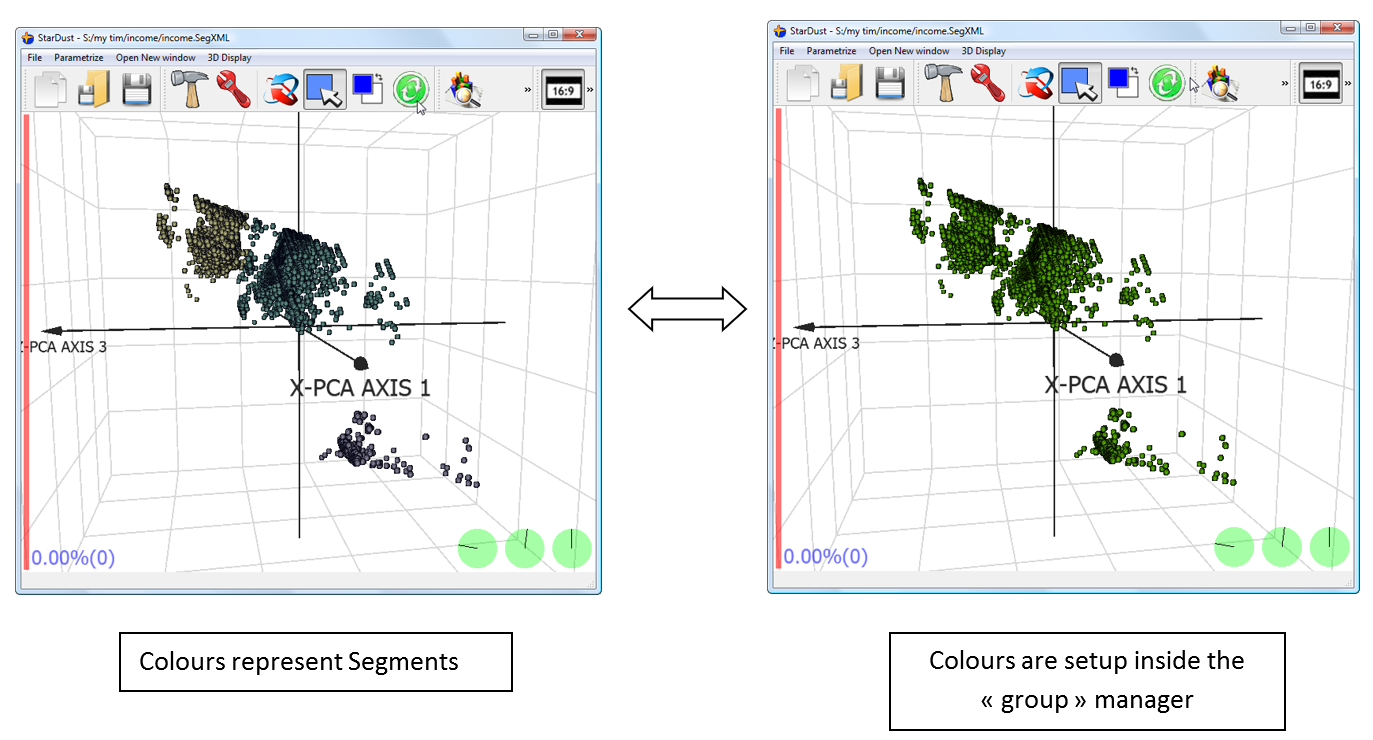
When you click the ![]() button, you alternate between the two different ways of computing the colours of all the points inside the 3D display. These two different ways are:
button, you alternate between the two different ways of computing the colours of all the points inside the 3D display. These two different ways are:
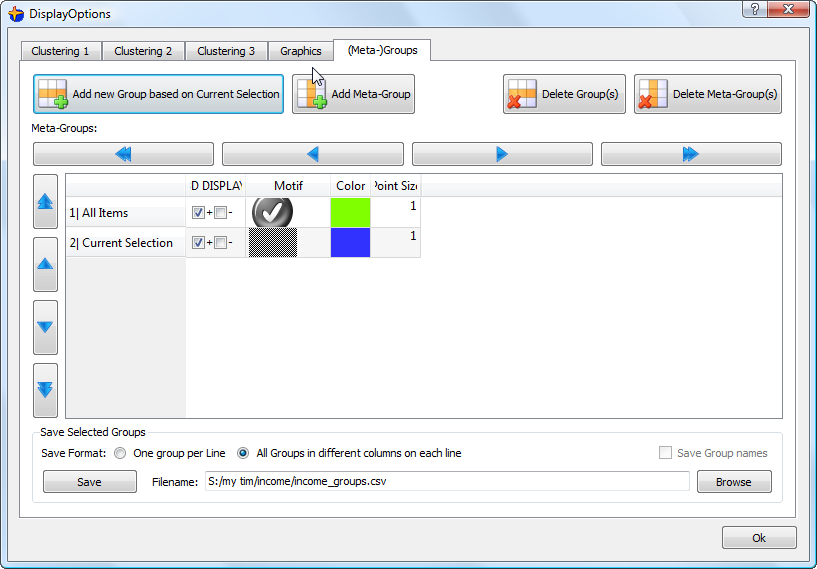
1.The colours of the points are setup through the advanced 3D display “Group” manager. You can access this manager when clicking the ![]() button and after selecting the “(Meta-)Groups” tab:
button and after selecting the “(Meta-)Groups” tab:

2.The colours of the points represent the different segments inside the population.
Typically, the ![]() button alternate between two “color-set”: for example:
button alternate between two “color-set”: for example:
