When you click the ![]() button, you alternate between two representations of the same “cloud of points”:
button, you alternate between two representations of the same “cloud of points”:
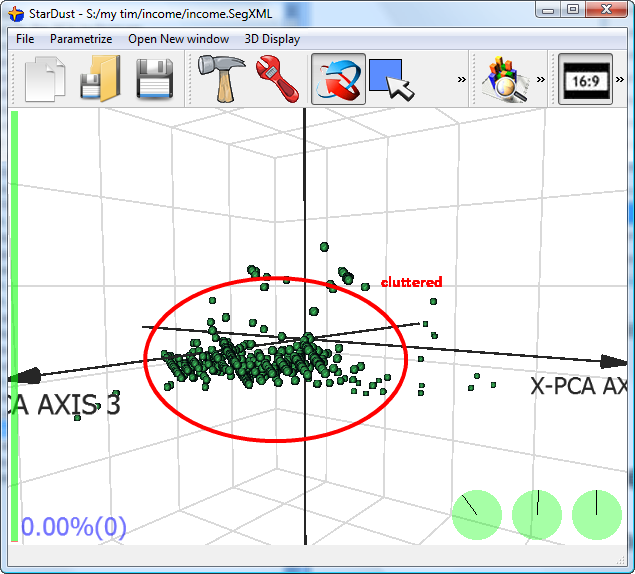
1.The first representation is the most respectful of the real distances that exists between points (individuals) inside your data. This is the most accurate representation of your population. ...But sometime (really often in reality), you end-up watching a graphic where everything is so cluttered that you can’t see anything. For example:

When you obtain such display, one easy solution to still “be able to see something” is to click on the ![]() button to “Strech” the “cloud of points” in order to completely fill-in the 3D cube.
button to “Strech” the “cloud of points” in order to completely fill-in the 3D cube.
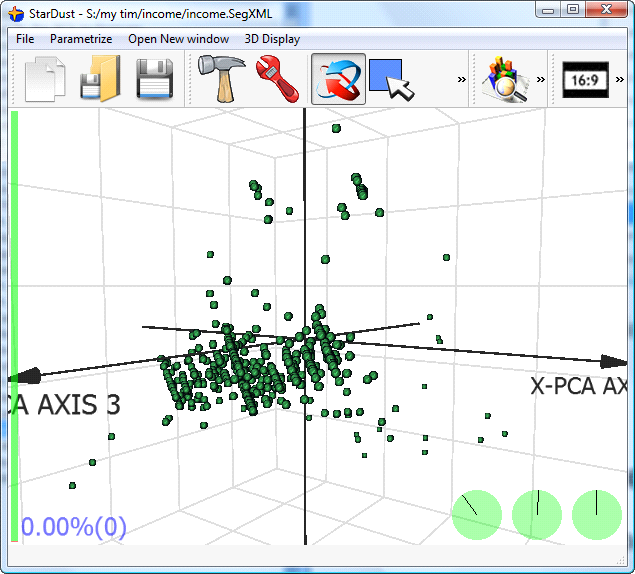
2.The second representation “stretch” the “cloud of points” to completely “fill-in” the 3D cube:
