The ![]() button opens a window that displays a summary table that contains the KL value of all the variables. You can sort the table in many different ways by clicking on the column headers. To remind you, the most interesting variables to display to characterize the current selection are the variables with the highest KL.
button opens a window that displays a summary table that contains the KL value of all the variables. You can sort the table in many different ways by clicking on the column headers. To remind you, the most interesting variables to display to characterize the current selection are the variables with the highest KL.
Instead of displaying the “Kullback-Liebler distance” (KL) for each of the variables, you can also use alternative distances that also characterize the distance between two distributions. The other alternative distances to the “KL” are the “Test-Value” distance and the “AUC” distance.
Note that, strictly speaking, we should not use the word “distance” but rather the word “dissimilarity” because a “distance” has several additional mathematical properties over a “dissimilarity”. We will use indifferently both words.
![]()
A possible interpretation of the test-value is “The test-value is the difference (positive or negative) between the mean of the 2 distributions evaluated in number of standard deviation of a normal distribution”.
![]()
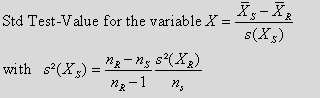
The standard definition of the “Test-Value” of a variable X between 2 distributions (the first distribution is defined on a Reference group R and the second distribution is defined on a “Selection” group S) is computed this way:
* For a continuous variable X:
Where we used the following notations:
R: is the “Reference” group: usually, the whole population.
S: is the “Selected” Group: usually, the mouse selection or the segment to analyze.
![]() : is the number of individuals inside the R group.
: is the number of individuals inside the R group.
![]() : is the number of individuals inside the S group.
: is the number of individuals inside the S group.
![]() : is the mean inside the R group of the variable X to analyze.
: is the mean inside the R group of the variable X to analyze.
![]() : is the mean inside the S group of the variable X to analyze.
: is the mean inside the S group of the variable X to analyze.
![]() : is the variance inside the R group of the variable X to analyze.
: is the variance inside the R group of the variable X to analyze.
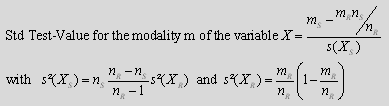
* For a nominal or binary variable X: we create a Test-Value for each modality m of the variable X:
Where we used the following notations:
R: is the “Reference” group: usually, the whole population.
S: is the “Selected” Group: usually, the mouse selection or the segment to analyze.
![]() : is the number of individuals inside the R group.
: is the number of individuals inside the R group.
![]() : is the number of individuals inside the S group.
: is the number of individuals inside the S group.
![]() : is the number of occurrence of the modality m inside the R group.
: is the number of occurrence of the modality m inside the R group.
![]() : is the number of occurrence of the modality m inside the S group.
: is the number of occurrence of the modality m inside the S group.
The advantage of the test-value over the KL is that the test-value can be positive or negative, depending on the “sense” of the difference between the two distributions. In opposition, the KL value is always positive.
![]()
StarDust also proposes you to use a simplified definition of the “Test-Value” of a variable X between 2 distributions. It is computed this way:
* For a continuous variable X:
Simplified Test-Value for the modality of the variable 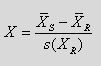
…where we used the same notations as previously.
* For a nominal or binary variable X: we create a Test-Value for each modality m of the variable X:
Simplified Test-Value for the modality of the variable 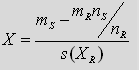
…where we used the same notations as previously.
![]()
The “test-value” is comparing the distribution of the same variable between two groups: the “Reference” group and the “Selection” group S. The equation of the “test-value” only makes sense if the “Selection” group S is completely contained inside the “Reference” group. This is why, in all the “test-value” computations, we are using a slightly modified definition of the “Reference” group R: our “Reference” group R is always the union between the “Reference” group given by the user inside the StarDust interface and the “Selection” group S.
For example, using the “test-value” we can see inside the table below that the mean of the age inside our selection is far greater than the mean of the age inside the whole global population:
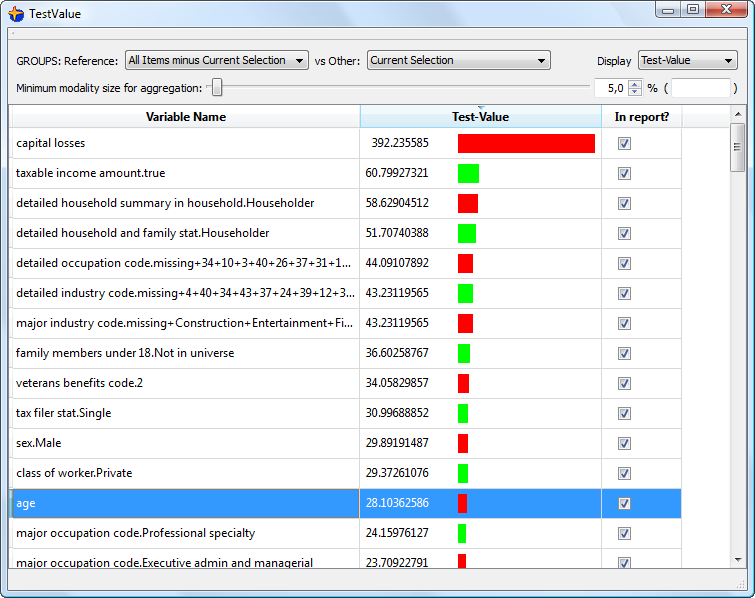
Based on the “positive Test-Value”, we can say that our selection contains “older” people. If we were only looking at the “KL” distance, the only thing that we can say is “the age is different inside the selection”. Thus, the “Test-Value” gives you a more precise description of your selection than the “KL” distance (because, with the Test-Value”, you have a “sign”: positive or negative: you can say “older” or “younger”, for example).