The ![]() button opens a window that allows you to compare the distribution of all the variables between two different groups of individuals. The variables are sorted from the highest KL to the lowest KL. Thus, the most interesting variables to characterize the current selection are the variables in top of the list.
button opens a window that allows you to compare the distribution of all the variables between two different groups of individuals. The variables are sorted from the highest KL to the lowest KL. Thus, the most interesting variables to characterize the current selection are the variables in top of the list.
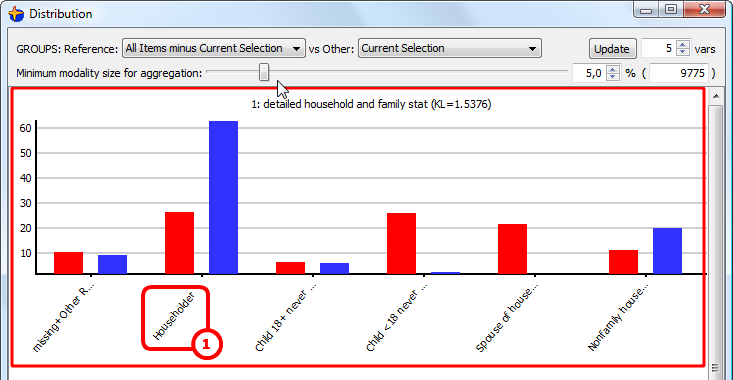
For example, if we continue the example of the previous section, we will see the following window:
... (the second variable in the list is not displayed
because it’s nearly the same as the first one)
... (other variables omitted)
This indicates us that our current selection is mainly characterized by people that are “householder”. This is really the “main characteristic” because it’s KL is 1.5376. ![]()
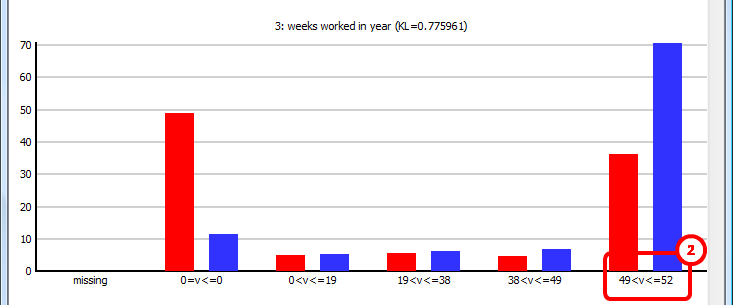
Another fact that characterized our selection is the fact that people, inside our selection, are always working (52 weeks per year)![]() , the full year (in opposition to the global population that includes many people that are not working at all!). This second characteristics is a lot less relevant than the first one because the KL is only 0.775961 for the variable “weeks worked in year” (in opposition to a KL of 1.5276 for the “householder” variable).
, the full year (in opposition to the global population that includes many people that are not working at all!). This second characteristics is a lot less relevant than the first one because the KL is only 0.775961 for the variable “weeks worked in year” (in opposition to a KL of 1.5276 for the “householder” variable).
It could be interesting to have a “summary-table” of the KL of all the variables: see next section to do that.