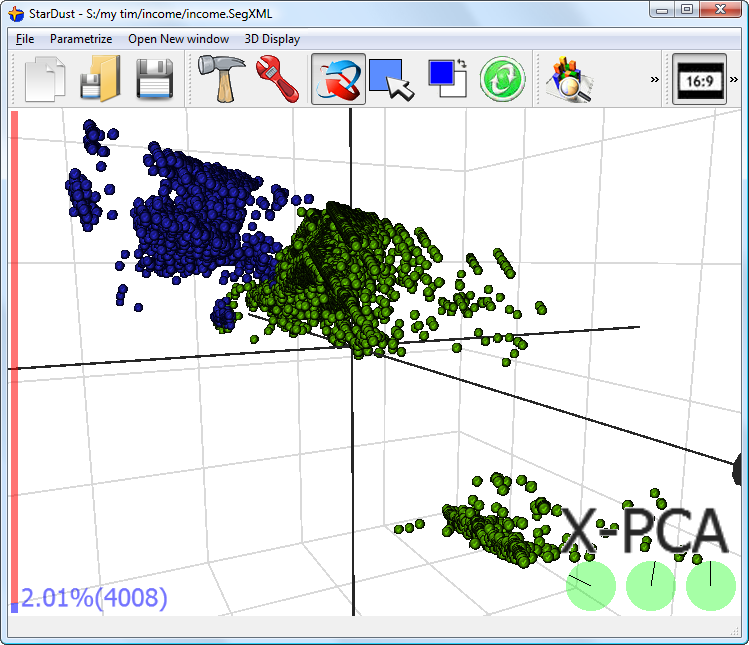
The ![]() button opens a window that allows you to compare the distribution of one variable between two different groups of individuals. For example, select with your mouse some individuals inside the main windows of TIMi:
button opens a window that allows you to compare the distribution of one variable between two different groups of individuals. For example, select with your mouse some individuals inside the main windows of TIMi:
... and then click on the ![]() button and select the “Age” Variable inside the combo-list on the upper-right side of the window.
button and select the “Age” Variable inside the combo-list on the upper-right side of the window.
You should now see this:
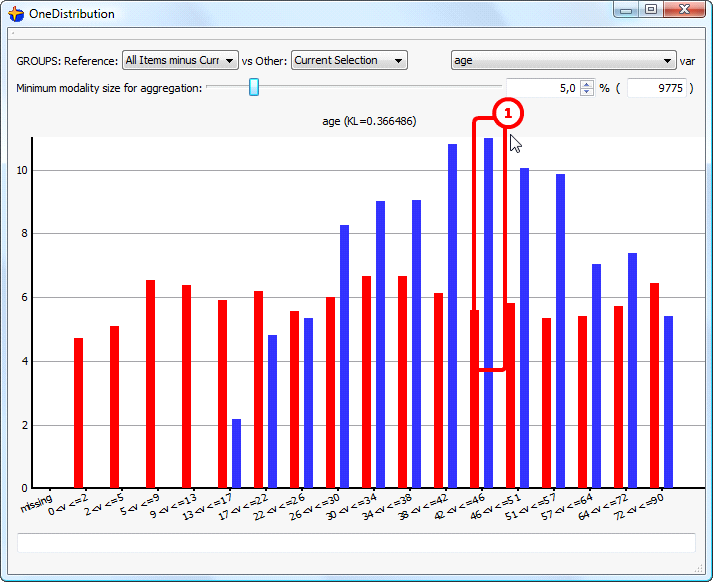
The red histogram represents the distribution of the age amongst the whole population (minus the people inside the selection). We can see that, inside the whole population, the histogram is more or less “flat”: all the ages are more or less represented equally.
The blue histogram represents the distribution of the age amongst the selected individuals. We can see (look here: ![]() ) that the people with age between 43 and 46 are more represented in the selection than inside the whole population.
) that the people with age between 43 and 46 are more represented in the selection than inside the whole population.
A common measure of distance between 2 histograms (between 2 distributions), is the “Kullback-Liebler distance” or, in short, the “KL”. In this example, the KL is 0.366486. If a variable possesses a high KL value, it means that the variable is strongly different between the 2 compared groups and, thus, strongly characterizes each group. We want to find good candidate-variable to characterizes a “group of individual” (a “group of individual” is usually a “segment”), we must look first at the variable with a high KL value. See the next section to do that.