Let’s take another example: We have a dataset with 3 columns. These 3 columns are:
•The Age expressed in Days (AgeD)
•The Age expressed in Months (AgeM)
•The Size (Size)
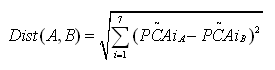
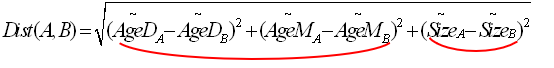
Using these 3 axises, we can define this Euclidian Distance:

(Note that we are using « normalized » distance)
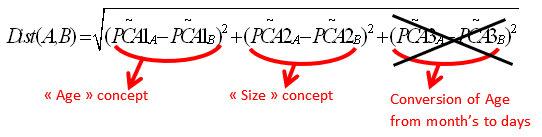
We can obtain the “age expressed in days”(AgeD) of an individual by multiplying by 31 the age of the same individual expressed in months. When we are using this relationship inside the equation of the Euclidean distance we arrive to this final equation.
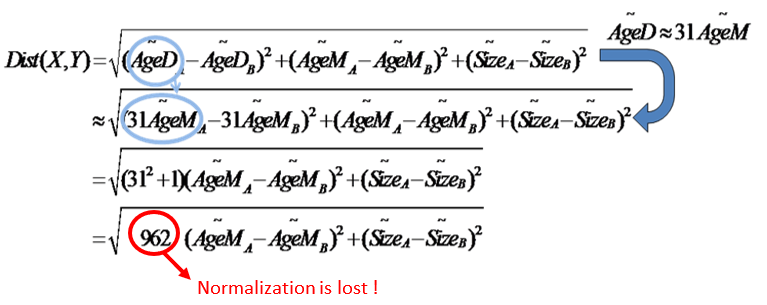
There is something very wrong about this final equation: We are changing the normalization factor. The « weight » given to the « age concept » is wrongly multiplied by more than 900. The « normalization » of the variables is lost when two variables (here: the “age expressed in days” and the “age expressed in months”) are representing the same concept.
Let’s represent graphically the “age expressed in days”(AgeD) and the “age expressed in months”(AgeM):
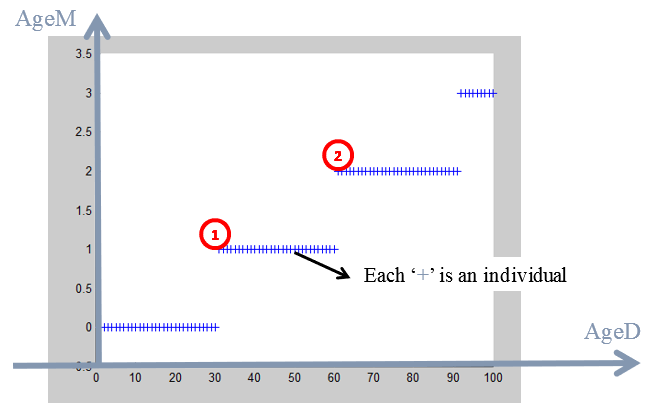
Each cross here is an individual. For example:
•an individual that is 31 days old is, indeed, one month old (AgeD=31; AgeM=1). ![]()
•an individual that is 63 days old is, indeed, 2 monthes old (AgeD=63; AgeM=2). ![]()
You may remember this chart from the previous section about “dimensionality reduction”:
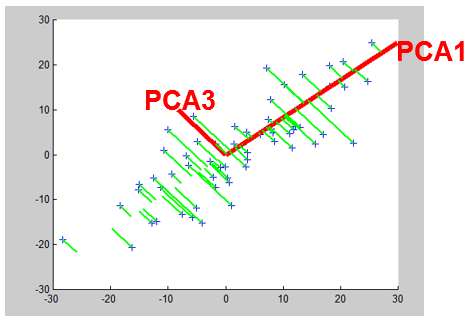
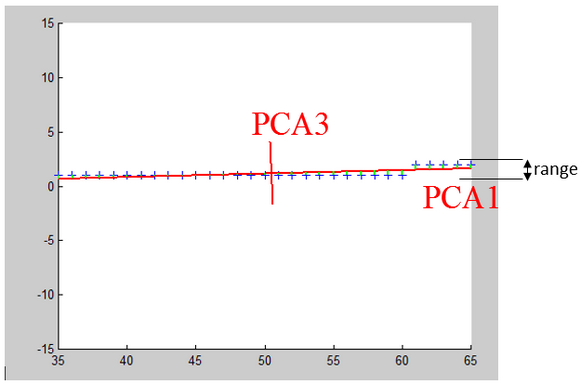
On this chart we computed the 2 PCA axises in order to reduce the dimension. We will do the same on this new population:
We obtain 2 PCA axises named “PCA1” and “PCA3”. If we compute the coordinates of each individual inside the new coordinate system defined by the “PCA1” and “PCA3” axises. We will notice that:
•OLD individuals have a HIGH value along the “PCA1” axis
•YOUNG individuals have a LOW value along the “PCA1” axis.
So the PCA1 axis represents the “age” concept. The PCA3 direction represents the small error in converting the age from months to days. The values along the PCA3 are completely uninteresting so we will simply never use them.
So, instead of defining the distance on the original axises: “age expressed in days”(AgeD) , “age expressed in months”(AgeM) and “size”(SIZE):
… we will now express the distance inside the PCA axises:
•PCA1 that represents the “age” concept
•PCA2 that represents the “size” concept
•PCA3 that represents the small error in converting the age from months to days.
This gives us:
Note that we did not include inside this new definition of the Distance, the distance along the « PCA3 » direction because it’s completely irrelevant. You can see that it is irrelevant because the range of values in the PCA direction is very small. This new definition of the distance is the best one possible. You can see the range along the « PCA3 » axis here:
This range is so small that it is totally useless and does not represent anything: it’s noise. So, it’s important to know the range of value along each PCA direction because you must drop from the distance-definition the PCA directions that have small variance. StarDust automatically displays the range of values along all PCA axis: In this graphic (from StarDust), we see that the range along the PCA8 axis is very small:
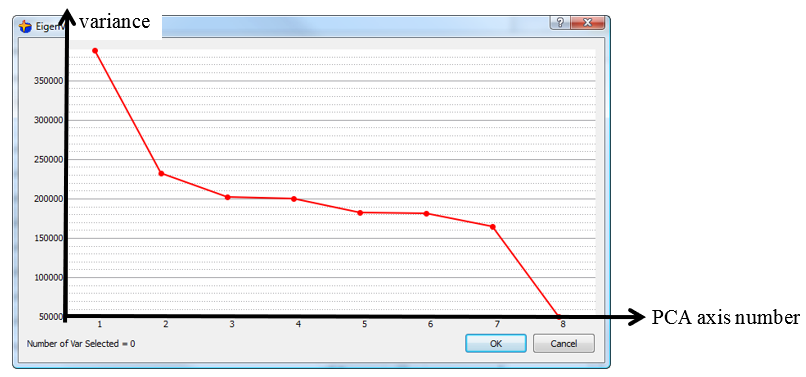
So, a good distance definition should only include terms from PCA1 to PCA7 and NOT PCA8: For example: