Let’s go back to the « Census-Income» database. For each individual, we have 7 variables (7 numbers):
1.“number of people working for an employer”
2.“capital losses“
3.“dividends from stocks”
4.“wages per hour “
5. “age”
6. “capital gain”
7. “weeks worked in year”
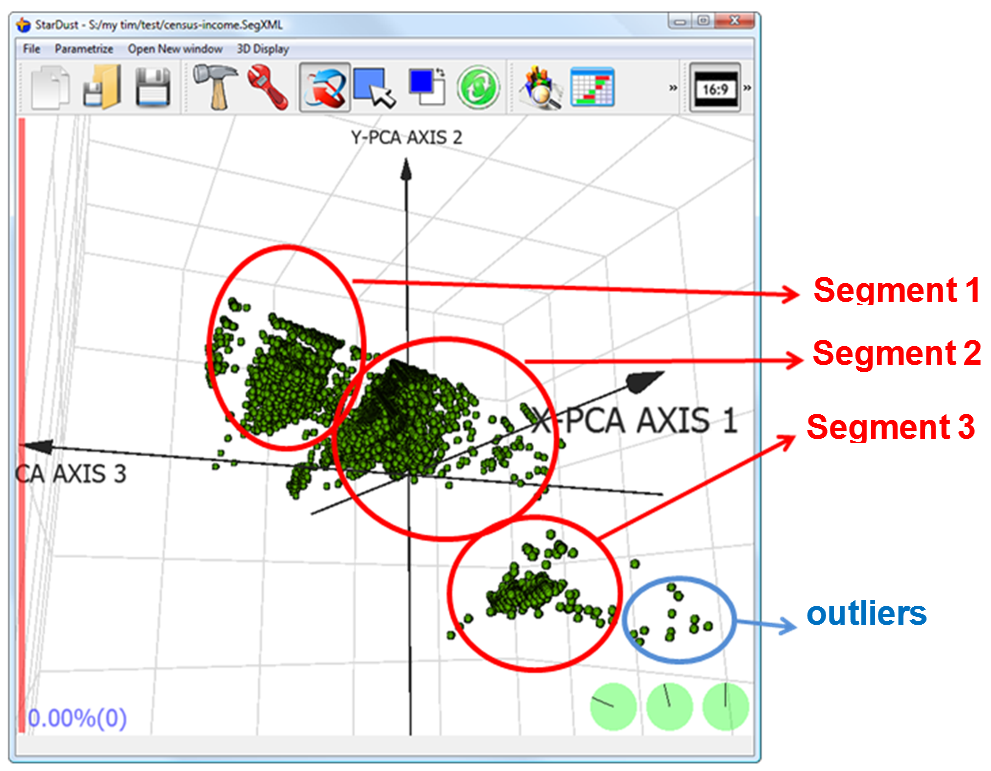
Thus, each individual is a 7D (seven dimensions) point. We will « project » these 7D points into 3 Dimension using the PCA technique. This is the result of the projection that is automatically delivered by Stardust:

Using Stardust, you can directly « see » for yourself the 3 segments inside the dataset. By simple visual inspection, you discover existing, natural segments inside your population. You can even see some outliers.