StarDust allows you to visually explore on your computer screen the entire studied population. This visual exploration allows you to find interesting figures about your data:
•Detect Outliers and non-valid data
•Find Segments of customers having similar behaviour
•…and Discover hidden patterns inside your data
Let’s directly illustrate the study using the classical census-income database. Each row of the census-income database is an individual.
We can represent this database graphically in the following way:
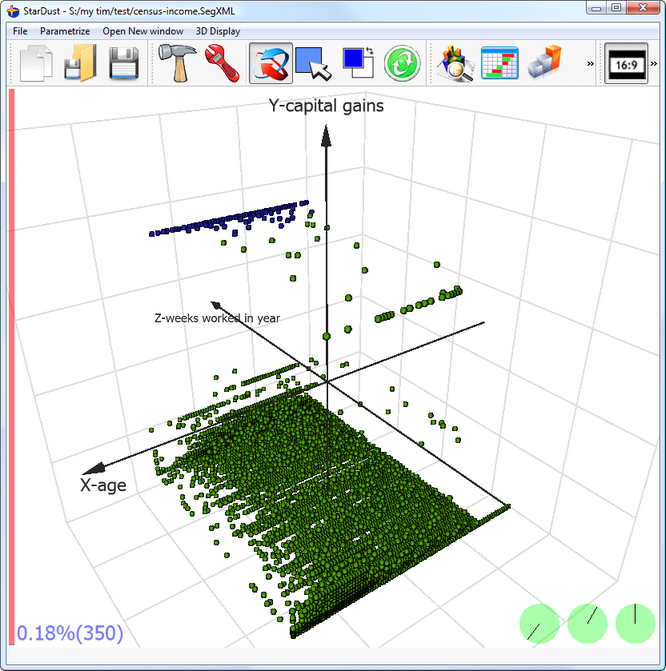
On this graphic, each “screen-dot” is an individual. The coordinates of one dot (one individual) are:
•X is the “age”
•Y is the “capital gain”
•Z are “weeks worked in year”
We could have used other information about the individuals to obtain a 3D coordinate because a 3D coordinate is, in the end, only 3 numbers. … and these 3 numbers could come from other columns, also present inside the dataset: We could have used:
1. “number of people working for an employer”
2.“capital losses“
3.“dividends from stocks”
4.“wages per hour “
5. “age”
6. “capital gain”
7. “weeks worked in year”
There are 7 numerical variables for each individual inside our dataset. So, we could represent an individual by a point with some coordinates in 7D. Unfortunately the human eye can only see in 3 dimensions so we could only select 3 columns: the “age”, the “capital gain” and the “weeks worked in year”. If we want to represent an individual exactly, we need to be able to see in, not only 3D, but in 7D, so it’s not possible. BUT there is a “trick”. The common trick is using a PCA. PCA stands for “principal component analysis”. The PCA is a common « trick » to do « dimensionality reduction ».