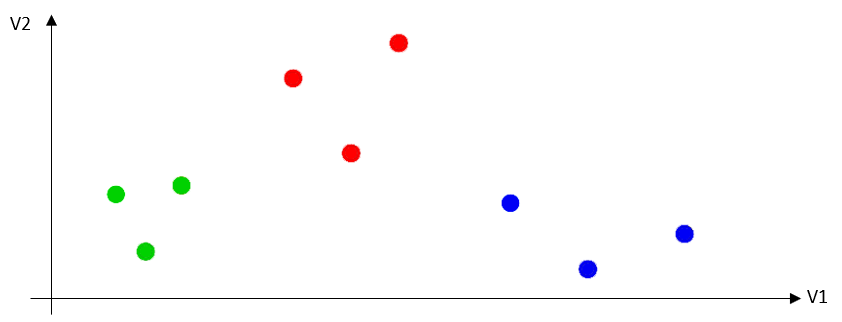
Let’s start with a small example where each customer is represented by only 2 values (v1 and v2): each customer is a 2D point. A segmentation model is a model that assigns a color to each of these points. Each color represents a different segment. Here we have represented a segmentation model that finds 3 different segments in the dataset:
•Segment one is composed by the customers in green
•Segment two is composed by the customers in red
•Segment three is composed by the customers in blue
See illustration:
To construct a segmentation model, Stardust uses (amongst other algorithms) the K-means algorithm. The K-means algorithm works this way: first we assign randomly one customer to each segment:
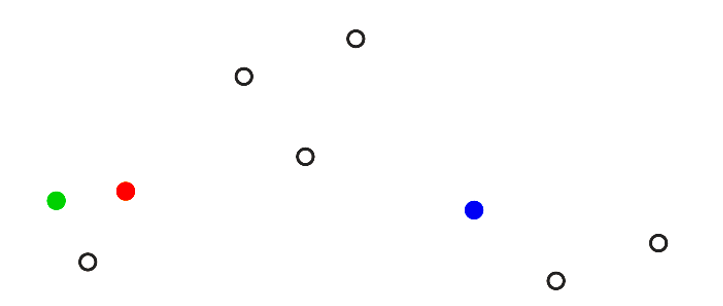
Thereafter, we assign all the customers to the nearest segment:
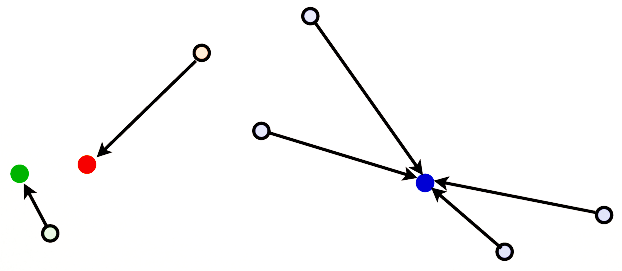
After, we re-compute the center of each segment.
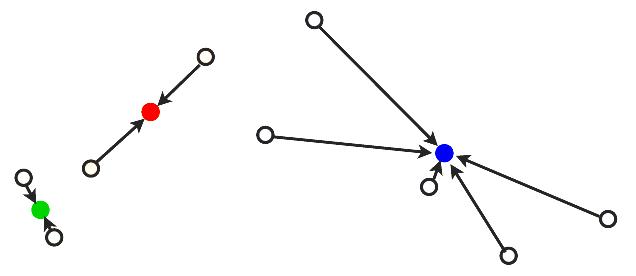
… and we repeat: We assign, once again, each point to the nearest “center”.
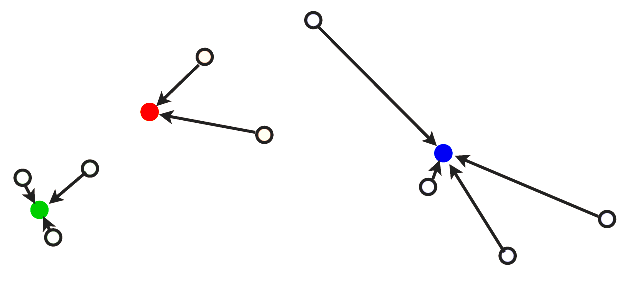
… and we re-compute the optimal centers.
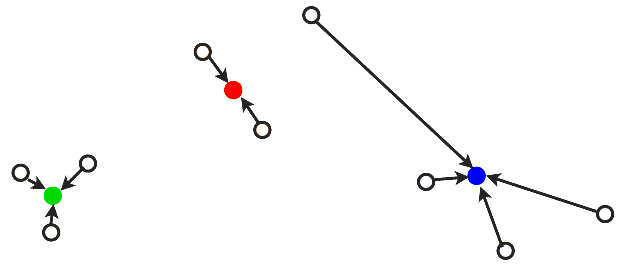
… and we repeat:
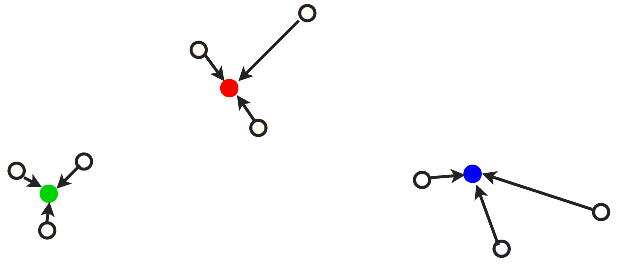
… and we repeat until the segmentation no longer changes:
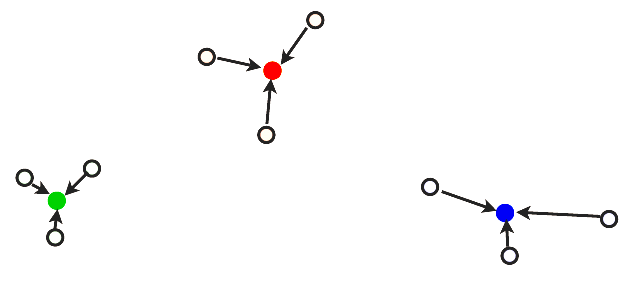
![]()
Please Note that the very first step of the K-means algorithm is to assign randomly one customer to each segment (and after iterate).
These “special” customers are named “seeds”. Usually, different “seeds” will give different (but hopefully close) segmentations. Thus, there is no unique segmentation: Depending on the “seeds” you will usually find different segments.
Amongst all the different segmentations proposed by TIMi, you should choose the segmentation that has the best interpretation from a business-point-of-view. TIMi offers you many different intuitive charts that allow you, in a few mouse clicks, to interpret easily your segmentation from a business-perspective, and therefore, to easily select the segmentation that is the best for you (and always from a business-perspective!).