Let’s debug the following script:
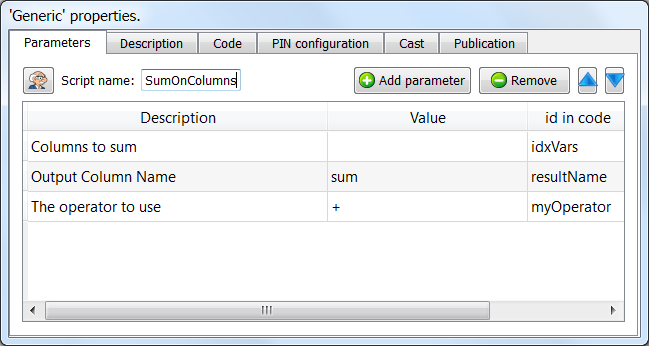
The script parameters are:
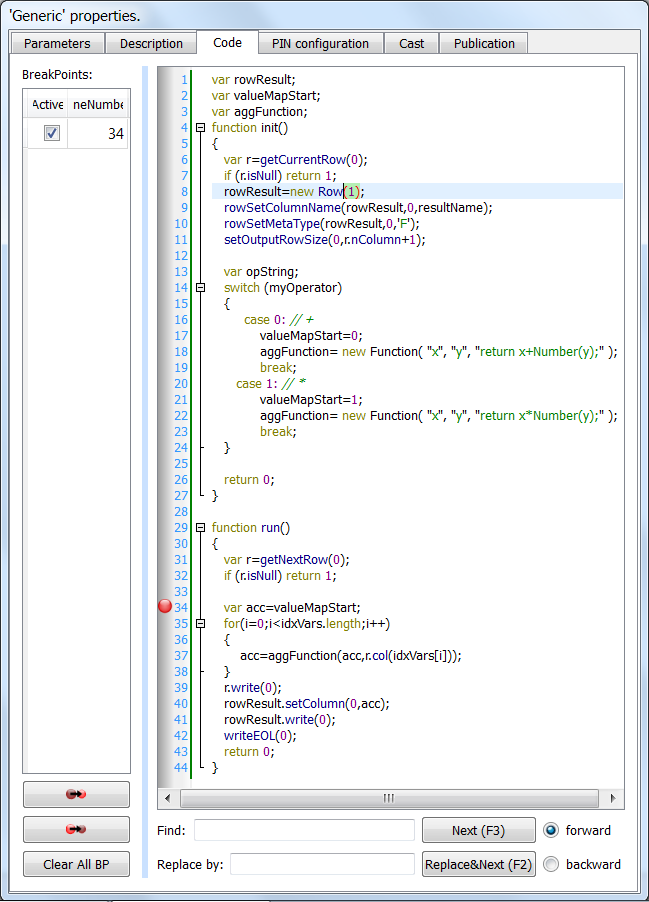
This script adds a new column into the output table. This new column is the sum of some user-selected-columns. To create new columns into an output table, we will simply write “row objects” (containing the additional columns) to the corresponding output pin. Inside this script we only add one column to the output table, so we only need to create one “row object” of size 1: see line 8. On line 11, we define the column name of the new column. On lines 39, 41 and 42, we are writing on the output pin 0: we write the “original” row and the “new” row (of size 1) (containing only our summation). The computation of the summation takes place on lines 34 to 38. The result of the summation is stored into a temporary JavaScript-variable named “acc” (short for “accumulator”). On line 40, this temporary result (stored in variable “acc”) is copied into the row object “rowResult”, so that it can be written on the output pin.
Note that we used on lines 18 and 22 the “Number()” function to obtain a numerical value from the string that is returned by the “col()” method of the row Object “r”. The same script without the call to the “Number()” function would have worked also but it would have delivered the concatenation of the strings inside the user-selected-columns (instead of the sum).
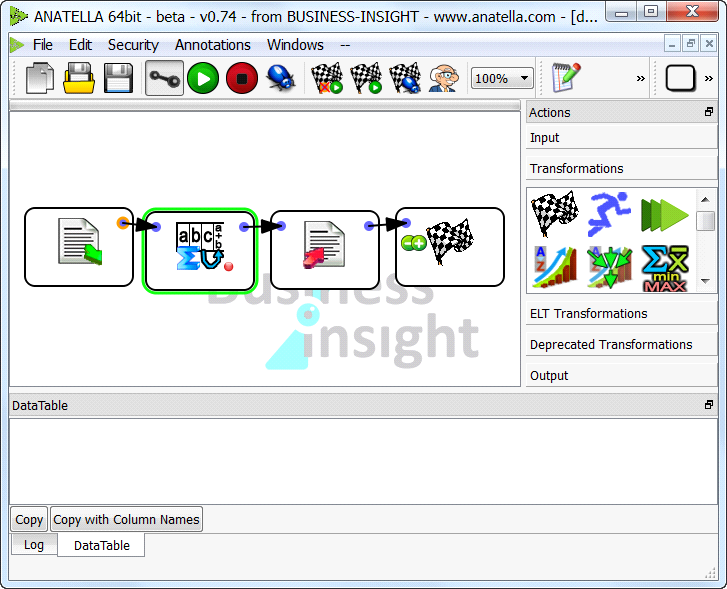
Click on the ![]() button (or Press F6)!
button (or Press F6)!
The Anatella-debugger starts:
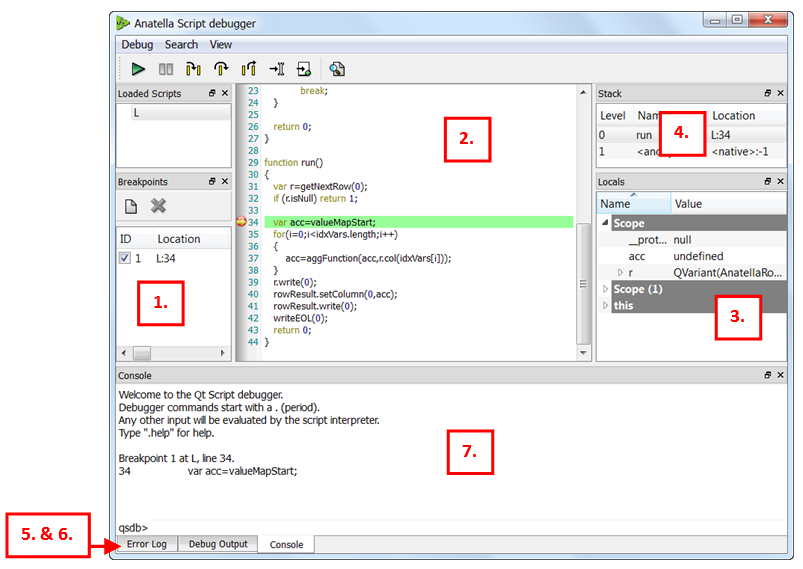
As requested, the execution stopped on row 34 of your script.
There are 7 different dock-windows available inside the main debugger window:
1.Breakpoint list:
The breakpoints list shows all the breakpoints that are set. A breakpoint can be disabled or enabled by clicking the checkbox next to the breakpoint's ID (the ID is provided so that the breakpoint can be manipulated through the console widget as well).
A condition can be associated with the breakpoint; the condition can be an arbitrary expression that should evaluate to true or false. The breakpoint will only be triggered when its location is reached and the condition evaluates to true.
Similarly, if the breakpoint's ignore-count is set to N, the breakpoint will be ignored the next N times it is hit.
A new breakpoint can be set by clicking the New Breakpoint button and typing in a location of the form “L:<linenumber>”. The breakpoint location can refer to an already loaded script, or one that has not been loaded yet.
2.Code window:
The code window shows the JavaScript code of the currently executed script. The widget displays an arrow in the left margin, marking the code line that is being executed. Clicking in the margin of a line will cause a breakpoint to be toggled at that line. A breakpoint has to be set on a line that contains an actual statement in order to be useful. When an uncaught script exception occurs, the offending line will be shown with a red background.
The code window is read-only; it cannot currently be used to edit and (re)evaluate scripts.
3.Locals: Maybe the most important window.
This window is extremely useful when debugging a transformation Script.
I cannot live without it anymore.
This window lists of all the defined variables (in the current stack frame). Only the variables that have been declared using the “var” keyword will be shown. For primitive variables (double, string, pure JavaScript objects), you can directly see the value of the variable. Objects can be expanded, so that their properties can be examined, recursively. Properties whose value has changed are shown in bold font.
Properties that are not read-only can be edited. Double-click on the value and type in the new value; the value can be an arbitrary expression. The expression will be evaluated in the associated stack frame. While typing, you can press the TAB key to get possible completions for the expression.
4.Stack:
This list all the function calls that have been made to arrive to the currently executed line.
The stack widget shows a backtrace of the script execution state. Each row represents one frame in the stack. A row contains the frame index (0 being the inner-most frame), the name of the script function, and the location (line number). To select a particular stack frame to inspect, click on its row.
5.Error log,
6.Debug Output:
These are less important windows. The “debug output” window is only used by the “printRow(rowObject)” command.
7.Console: The second most important window!
The Console window allows you to interactively run parts of your scripts: You can call your own functions, change value of variables, make nearly any computations that you want, etc…
The console widget provides a command-line interface to the debugger's functionality, and also serves as an interactive script interpreter. The set of commands and their syntax is inspired by GDB, the GNU Debugger. Commands and script variables are auto-completed through the TAB key.
Any console command that causes a change in the debugger or debugger target's state will immediately be reflected in the other debugger components (e.g. breakpoints or local variables changed).
The console provides a simple and powerful way of manipulating the script environment. For example, typing "x" and hitting enter will evaluate "x" in the current stack frame and display the result. Typing "x = 123" will assign the value 123 to the variable x in the current scope (or create a global variable x if there isn't one -- scripts evaluated through the console can have arbitrary side effects, so be careful).
Furthermore, Anatella has 4 special script functions that are very useful inside the console (see next page for more information about these functions):
rowToArray(rowObject) |
rowToObject(rowObject) |
printRow (rowObject) |
clearLog() |
The script execution can be resumed in one of the following ways (These are standard commands and shortcuts also available inside the well-known Microsoft-Visual-Studio debugger):
•Continue (![]() - F5): Evaluation will resume normally.
- F5): Evaluation will resume normally.
•Step Into (![]() - F11): Evaluation will resume until the next statement is reached.
- F11): Evaluation will resume until the next statement is reached.
•Step Over (![]() - F10): Evaluation will resume until the next statement is reached; but if the current statement is a function call, the debugger will treat it as a single statement.
- F10): Evaluation will resume until the next statement is reached; but if the current statement is a function call, the debugger will treat it as a single statement.
•Step Out ( ![]() - Shift-F11): Evaluation will resume until the current function exits and the next statement is reached.
- Shift-F11): Evaluation will resume until the current function exits and the next statement is reached.
•Run to Cursor (![]() - Ctrl-F10): Run until the statement at the cursor is reached.
- Ctrl-F10): Run until the statement at the cursor is reached.
Press 3 times on the ![]() button (or press 3 times F10): you can see, in the “locals” window, the value of the “acc” variable updating as the Anatella-script is executed step-by-step.
button (or press 3 times F10): you can see, in the “locals” window, the value of the “acc” variable updating as the Anatella-script is executed step-by-step.
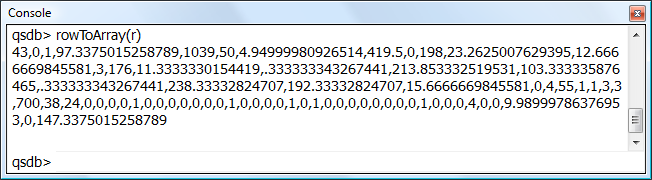
In the “locals” window, you cannot directly see the content of the “r” object because behind this apparently simple JavaScript object, there is, in reality, a complex, highly optimized, C++ class. To see the content of the row object “r”, write inside the Console “rowToArray(r)”: you will see the whole row “r”, where each column is separated by a comma:
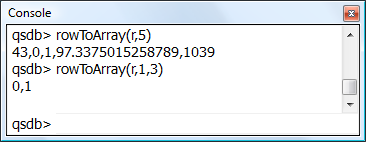
If you only want to see the first 5 columns of the row “r”, you type “rowToArray(r,5)”. If you only want to see the columns 1 (included) to 3 (excluded) of the row “r”, you type “rowToArray(r,1,3)”. For example:
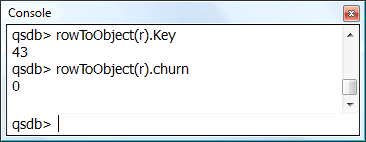
If you only want to see the column named “Key” of the row “r”, or the column named “churn” of the row “r”, you type in the Console window:
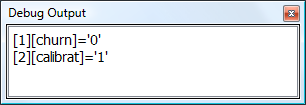
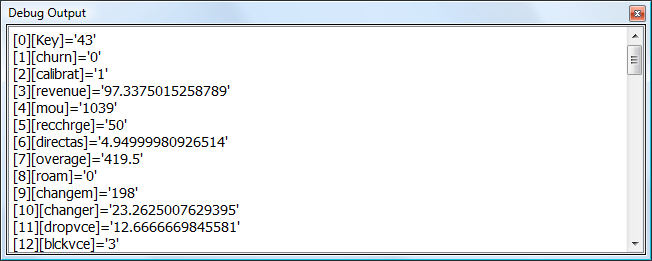
Finally, if you want to see a nice display of the row object inside the “debug output” window, you type in the Console window “printRow(r)” …and you obtain in the following “debug output” window:
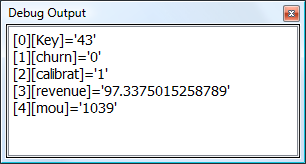
Once again, additional parameters to the “printRow(r)” function allow you to select the exact portion of the row that you want to see. For example: “printRow(r,5)” shows:
Another example: “printRow(r,1,3)” shows: