To start the Anatella JavaScript debugger, you must do two things:
1.Define a break point into the javascript-source-code that you intend to debug (or you can also simply re-enable an old break point that has been defined previously).
2.Run your Anatella-Graph in “debug” mode.
9.10.1.1. Managing break points
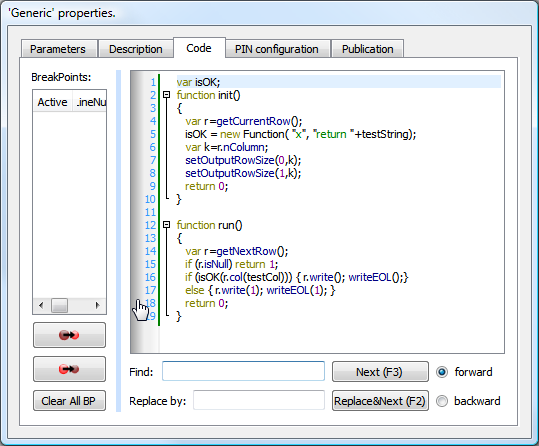
For example, if i want to put a breakpoint at the line 18 of my JavaScript, I simply click just next to the “18” number inside the code window:
… and we obtain:
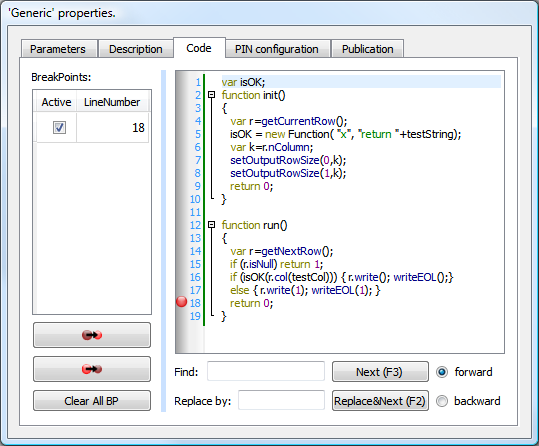
You can re-click on the same spot to remove the breakpoint.
Inside the breakpoint-list table (in the left panel), you can:
1.Click on the check box to disable/enable a breakpoint. If all the breakpoints are disabled, the debugger won’t be used.
2.Click on the second column (containing the “Line number” of the breakpoint) to directly “move to” this line into the code window.
Using the ![]() button, you can enable all breakpoints.
button, you can enable all breakpoints.
Using the ![]() button, you can disable all breakpoints.
button, you can disable all breakpoints.
Using the ![]() button, you can clear (delete) all breakpoints.
button, you can clear (delete) all breakpoints.
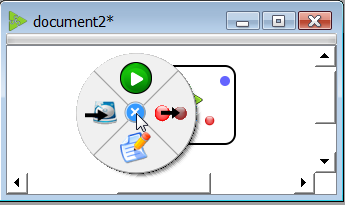
To Enable/disable breakpoints, you can also use the circular-context-menu of your Action: Right-mouse-click on a script-based Action inside your Anatella-Graph and select the ![]() /
/![]() option: For example: this will disable all the break points of the selected Action:
option: For example: this will disable all the break points of the selected Action:
The Anatella-debugger has one limitation: You cannot debug several different Actions at the same time. Only one Action “at-a-time” can have some active breakpoints. Only the action with the active breakpoints will appear into the debugger. You can easily select which Action will be debugged using the above circular menu and the ![]() /
/ ![]() option (to quickly “enable” the breakpoints of the Action that you want to debug and disable all the other ones).
option (to quickly “enable” the breakpoints of the Action that you want to debug and disable all the other ones).
9.10.1.2. Running an Anatella-Graph in “debug” mode
There are two “normal” ways of executing an Anatella-Graph (see section 4.4):
1.You can click on the ![]() button inside the main toolbar of Anatella: see section 4.4.1
button inside the main toolbar of Anatella: see section 4.4.1
2.When you are in “Run Mode” (i.e. when the ![]() button in the main toolbar is “checked”), each time you click on an output pin, Anatella runs the graph up to this point and creates the corresponding “HD Cache file”: see sections 4.2.6, 4.4.2 and 4.5.2
button in the main toolbar is “checked”), each time you click on an output pin, Anatella runs the graph up to this point and creates the corresponding “HD Cache file”: see sections 4.2.6, 4.4.2 and 4.5.2
There are two corresponding ways to run an Anatella-Graph in “debug” mode (to be able to use the Anatella-Script-debugger):
1.You can click on the ![]() button inside the main toolbar of Anatella.
button inside the main toolbar of Anatella.
2.Switch to “Run Mode” (i.e. check the ![]() button) and enable debug: check the
button) and enable debug: check the ![]() button inside the main toolbar of Anatella. Now, each time you click on an output pin, Anatella runs the graph (with the debugger) up to this point (and Anatella also creates the corresponding “HD Cache file”).
button inside the main toolbar of Anatella. Now, each time you click on an output pin, Anatella runs the graph (with the debugger) up to this point (and Anatella also creates the corresponding “HD Cache file”).