The ![]() multiJoin Action is usually quite slow (especially when there are many large “slave” tables). Thus, in the example above, the section 2 is the slowest. Section 2 thus drives the processing speed of the whole Anatella data-transformation graph.
multiJoin Action is usually quite slow (especially when there are many large “slave” tables). Thus, in the example above, the section 2 is the slowest. Section 2 thus drives the processing speed of the whole Anatella data-transformation graph.
Instead of using 1 CPU to execute the section 2, we could use 4 CPU’s:
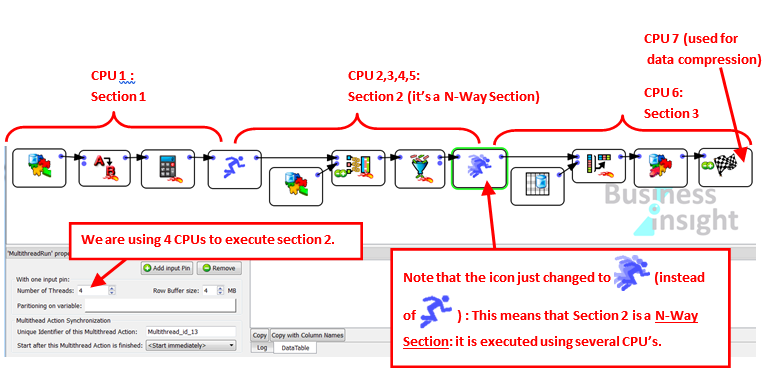
A section that is executed using several CPU’s is named a “N-Way” section. To create a “N-Way” section, simply set the parameter “Number of threads” of the ![]() Multithread Action to the value 2 or higher.
Multithread Action to the value 2 or higher.
![]()
You cannot obtain any data preview of the output pins of the Actions included inside a “N-Way” section. To notify you of this limitation, these pins turn RED during graph execution. If, for some reason, there exists an HD Cache for a pin that turns RED, it will be deleted.
All HD caches are disabled (and deleted) inside “N-Way” sections. Thus, we suggest you to avoid using “N-Way” sections during the initial Anatella graph development phase. Once your graph has been tested and is working properly, you can start adding “N-Way” sections to increase processing speed.
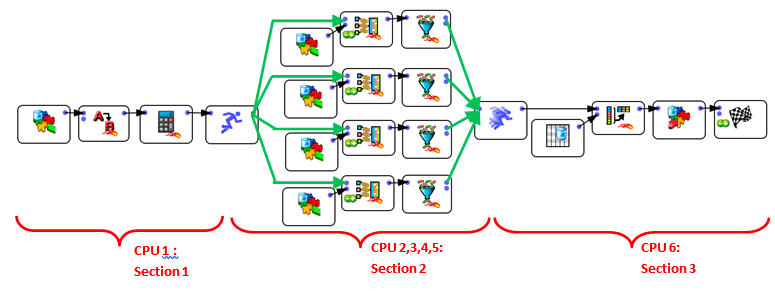
Internally, when you ask to execute a N-Way section, Anatella automatically duplicates all the Actions inside the N-Way section and then dispatch a constant “flow of rows” to each of the duplicates. Each duplicate is running “in parallel”, on a different CPU. If we go back to the above example, you could think of the “conceptual” graph that is *really* executed as the following one:
Now, with this new setting (i.e. with 4 CPU’s for section 2), the slowest segment (i.e. the one that drives the global speed of the Anatella graph) could be section 1 or 3. It can be difficult to adjust properly the number of CPU’s assigned to each section to obtain the highest processing speed. Let’s avoid this difficulty by rewriting the same data transformation in a slightly different way:
The above data transformation graph is optimal in terms of execution speed because:
•Section 1 and section 3 are very fast because they each contain only one Action that consumes very little CPU. Thus, if there is a bottleneck, it should be in section 2 (and not in section 1 or 3).
•Section 2 is highly multithreaded (it uses 6 CPU’s). If we could afford more CPU’s, we would use them in section 2 because if, there is a bottleneck, it should be here.
The above graph is *nearly* optimal for a 8-cores CPU (because it exactly uses 8 CPU’s).
However, it can still be improved a little:
•The only Action included in Section 1 is reading a .gel_anatella file.
Reading a .gel_anatella file is a 2 step-process:
oRead a bunch of binary data (typically 1MB) from the Hard Drive and copy into main RAM memory. This takes 90% of the time.
oDe-compress the binary data into usable data. This takes 10% of the time.
This means that the CPU assigned to Section 1 will be idle most of the time (90% of the time), simply waiting from the Hard Drive to complete the “Read” (i.e. the “step 1”.). When a CPU is idle, we could use it to execute another section of the graph.
•The only Action included in Section 3 is writing a .gel_anatella file.
Writing a .gel_anatella file is a 2 step-process:
oFill-in an internal memory buffer in RAM with a whole bunch of data (typically 4MB). (5% of the time)
oTell the compression-thread to compress the data (25% of the time) and flush the data on the hard-drive (i.e. copy the data from main RAM memory to hard drive)(70% of the time).
This means that the CPU assigned to Section 3 will be idle most of the time (70% of the time), simply waiting from the Hard Drive to complete the “Write” (i.e. the “step 2”.). When a CPU is idle, we could use it to execute another section of the graph.
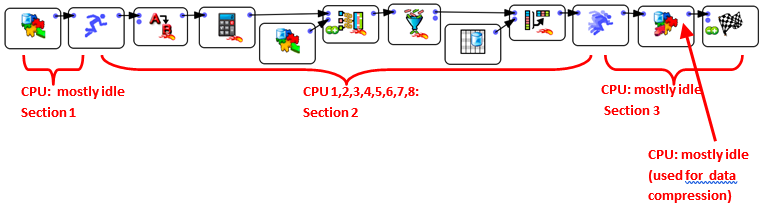
Knowing that the CPU’s assigned to section 1 & 3 will be idle most of the time, we can re-assign these 2 CPU’s to section 2: We finally obtain:
The above graph is optimal for a 8-cores CPU (because it exactly uses 8 CPU’s).