|
<< Click to Display Table of Contents >> Navigation: 5. Detailed description of the Actions > 5.13. TA - R_Discovery Analytics > 5.13.7. DBSCAN Clustering (
|
Icon: ![]()
Function: R_DBSCAN
Property window:
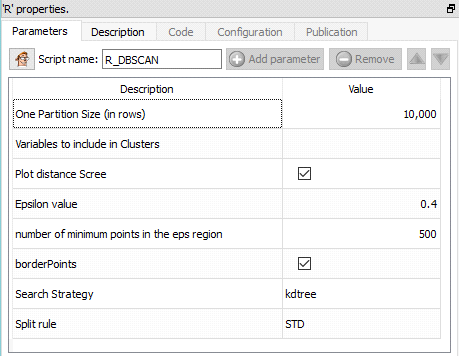
Short description:
DBSCAN Clustering.
Long Description:
This Action is mainly for explanatory/teaching purposes. If you want to create a better segmentation, you should use Stardust.
The DBScan algorithm is often used in geographic settings, to understand segments about mobility, for example.
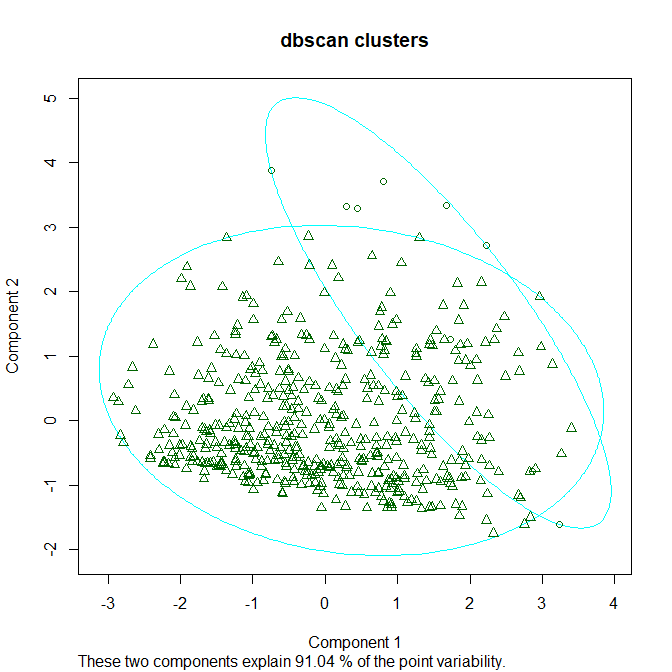
It is performed in two steps. First, run to plot the distance plot, and draw and imaginary line between the last point of inflection, and the vertical axis. This will tell you roughly what the value of Epsilon should be (see red line, in this case, about 15).
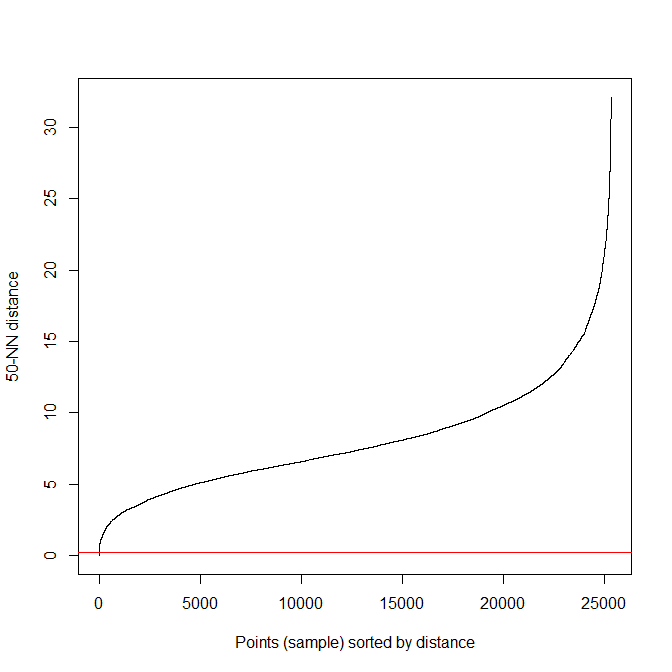
You will then be able to get segment assignment and a plot: