|
<< Click to Display Table of Contents >> Navigation: 5. Detailed description of the Actions > 5.11. TA - R Visualization > 5.11.17. Pie Chart (
|
Icon: ![]()
Function: R_PieChart
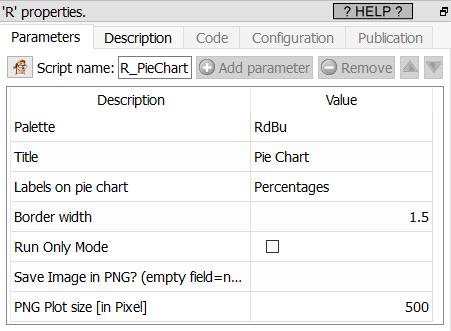
Property window:
Short description:
Create a Pie Chart.
Long Description:
This plot is a popular visualization, although it should not be used in most cases as a histogram typically gives a better visualization.}
The input table is:
•first column: the different labels of the different pies.
•second column: the sizes of the different pies.
The input table can easily be created using an Aggregate Action.
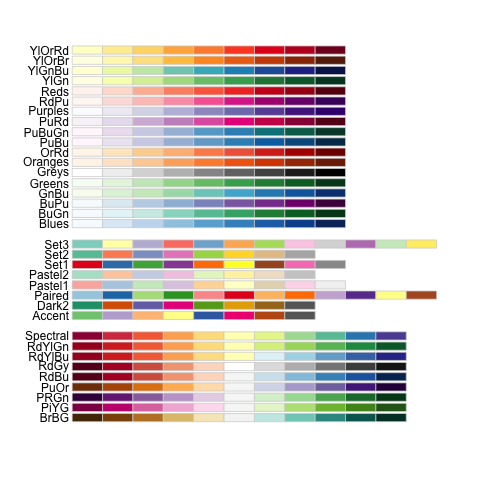
The different available palettes are:
Labels of the different Pies: Select the variable with the label of the category
Size of the different Pies: select the variable with the size of the category
Labels on Pie Chart: Run Only Mode: Select “None”, “Value” or “Percentage”
Run Only Mode: select this option to generate a PNG image of the plot without displaying it. If you forget to specify a filename, this will generate an error.