|
<< Click to Display Table of Contents >> Navigation: 5. Detailed description of the Actions > 5.11. TA - R Visualization > 5.11.18. Plot Time Series (
|
Icon: ![]()
Function: PlotTimeSerie
Property window:
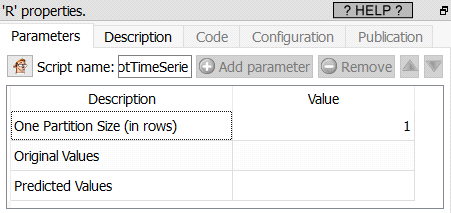
Short description:
Plot a time series.
Long Description:
Plot two corresponding series:
•Past data
•Future data
The data must be stored in COLUMNS, and will generate one plot per row.
An example: