|
<< Click to Display Table of Contents >> Navigation: 5. Detailed description of the Actions > 5.11. TA - R Visualization > 5.11.16. Box Plot (
|
Icon: ![]()
Function: R_BoxPlot
Property window:
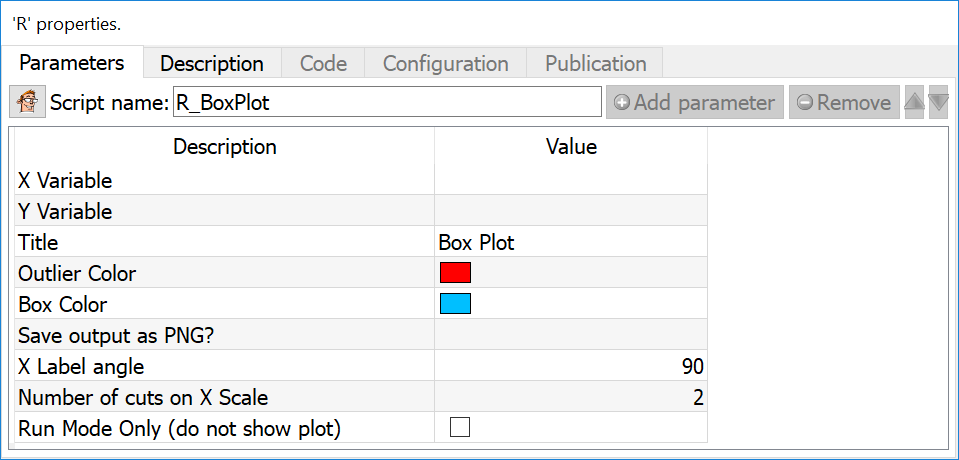
Short description:
Create a box plot.
Long Description:
Create a box plot. This chart is useful to compare bi-variate distributions in which the X axis is a nominal variable (age group, product line, eduction, etc) and the Y axis is a continuous variable (price, discount, income, etc.).
Partition Type: To analyze many groups in a single operation, you can split the data based on a partition (region, race, zone, etc.) The data needs to be sorted based on this variable. It will automatically generate k plots
Var: X Variable: Select the nominal variable to split in the horizontal axis
Var Y: Select the continuous variable to observe.
Optional Target: Select a third variable to set colors based on density
Run Mode Only: Do not display plot. This is particularly useful when working with partitions, as there is a limit to 50 plots “visible”. This option can generate hundreds or thousands of plots without filling your RAM.