|
<< Click to Display Table of Contents >> Navigation: 5. Detailed description of the Actions > 5.11. TA - R Visualization > 5.11.15. KS Curve (
|
Icon: ![]()
Function: R_K-S_Plot
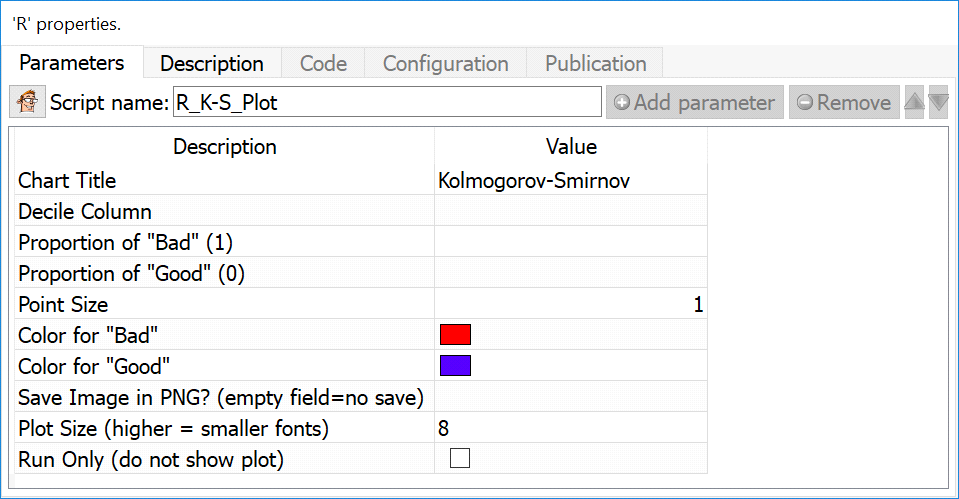
Property window:
Short description:
Create a Kolmogorov-Smirnov curve after applying a model.
Long Description:
Create a Kolmogorov-Smirnov curve after applying a model. The input data consists of an aggregated table (usually deciles) in which we have computed:
•Proportion of “bad” in each decile (usually the target)
•Proportion of “good” in each decile
•The decile
This curve is often used in credit risk analysis, but is – generally speaking – not a very robust way to evaluate a model as it assumes a normal distribution of the scores which is not appropriate if you work with actual transactional data. Some authors suggest that a logartimic transformation can improve it, but this would only be appropriate if using a logistic regression (which depends on transformed scores, and in general WoE), but not with any ML algortithm that do not use this transformation.