|
<< Click to Display Table of Contents >> Navigation: 5. Detailed description of the Actions > 5.11. TA - R Visualization > 5.11.12. Multiplot (
|
Icon: 
Function: My_R_Multiplot
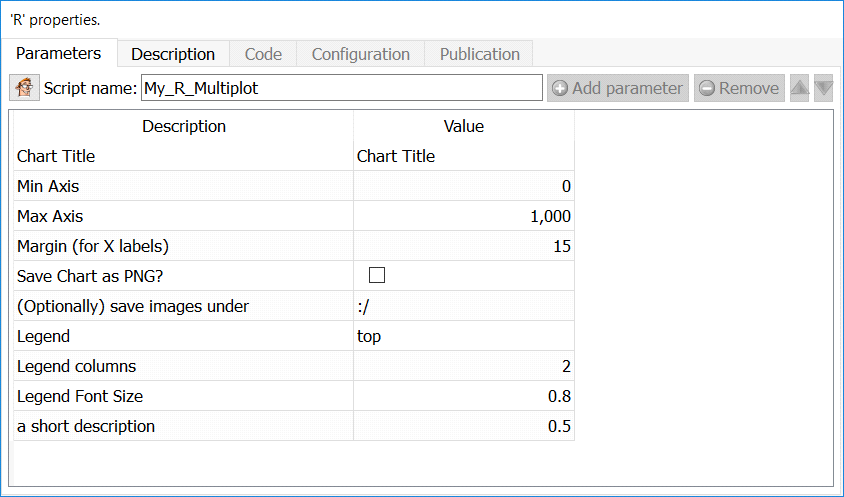
Property window:
Short description:
Create a Plot with multiple series
Long Description:
The information used consists of thre groups of columns:
- X axis
- Data
- Key
Main title: the title of the chart
Min Axis: the minimum value on the Y axis
Max Axis: the maximum value on the Y axis
Margin (for X labels): margin below the axis
Legend: set legend position
Legend Columns: number of columns to display the legend text
Legend font Size: size of legend characters
Save chart as PNG: select how the labels are displayed in the waterfall plot
PNG Directory: select the color of the labels on the X axis
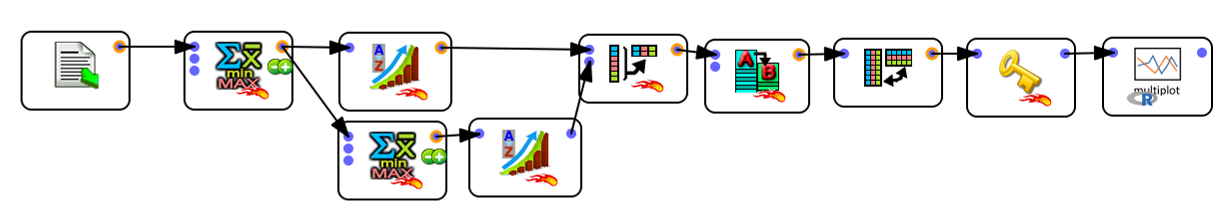
To obtain this data, we usually require a few transformations, as illustrated below. The data must be organized as one series per column, hence a transposition.