|
<< Click to Display Table of Contents >> Navigation: 5. Detailed description of the Actions > 5.11. TA - R Visualization > 5.11.13. Population Pyramid Plot (
|
Icon: ![]()
Function: PopulationPyramid
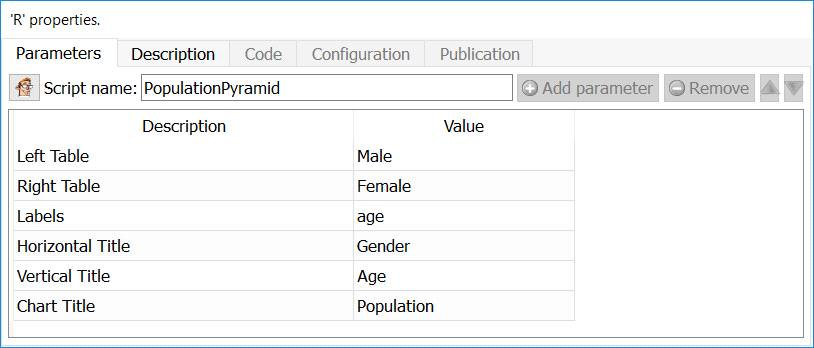
Property window:
Short description:
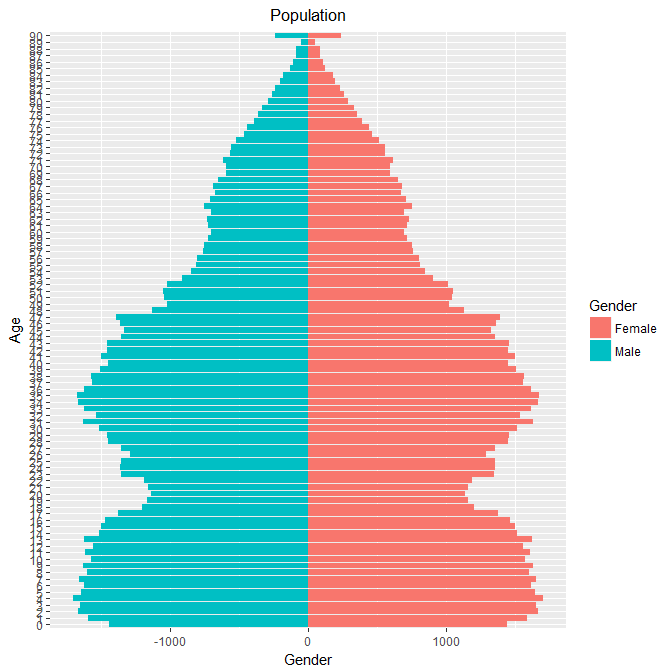
Create a population pyramid by gender.
Long Description:
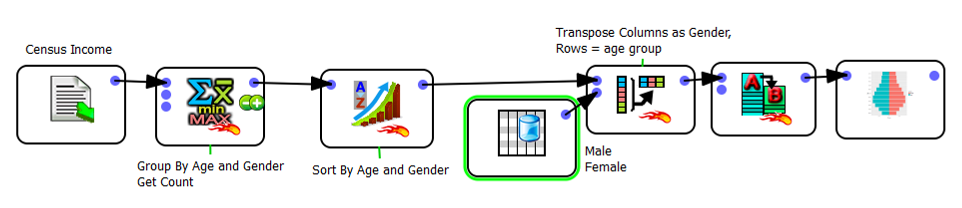
Select columns in which aggregated information is available. To process vast amount of information, this plot requires the data to be pre-processed in Anatella: a population of 5.000.000 individual will quickly saturate the RAM in R, which is why the following pre-processing is required
Parameters:
Left Table: the variable to display on the left (one Column)
Right Table: the variable to display on the right (one Column)
Labels: the labels of the vertical axis (age, one Column)
Horizontal Title: the title of the base (usually
Gender, text)
Vertical Title: the title of the vertical axis
(usually Age, text)
Chart Title: the title of the plot (text)