|
<< Click to Display Table of Contents >> Navigation: 5. Detailed description of the Actions > 5.11. TA - R Visualization > 5.11.11. Waterfall Plot (
|
Icon: ![]()
Function: Waterfall_Chart
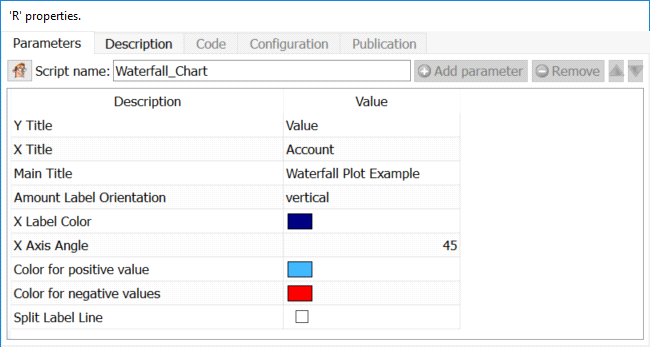
Property window:
Short description:
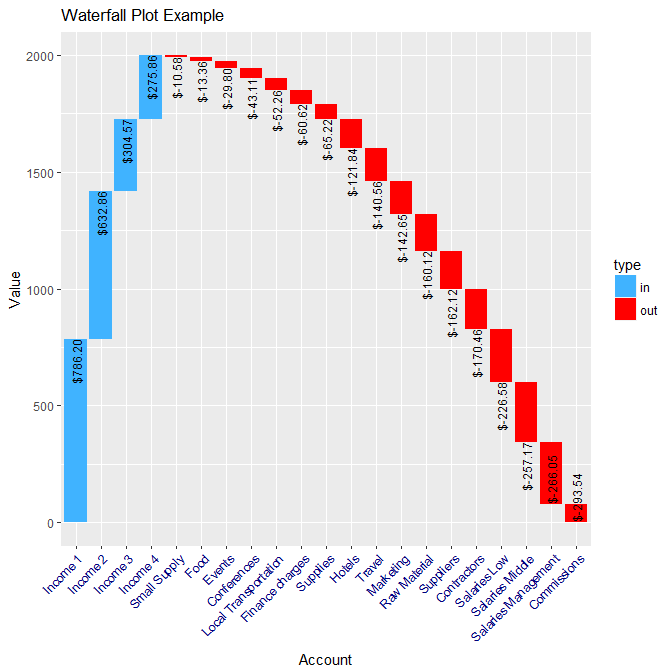
Create a waterfall Plot.
Long Description:
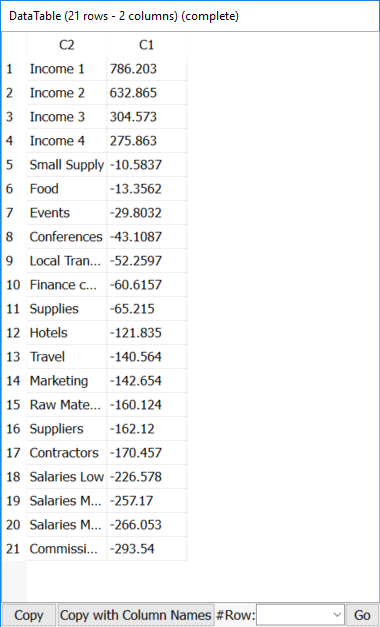
The information used consists of two columns: category, and amount.
Typically, this chart is used to understand the cost structure of organizations, product categories or services.
The information must be SORTED on AMOUNT -> DECREASING, and it is a good idea to always do a bit of cleaning.
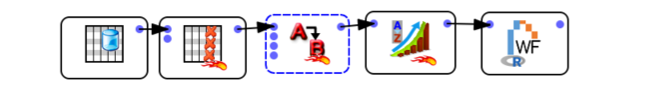
In the below example, we simply order the columns properly, clean the values to make sure everything is numerical, sort the data and plot the chart.
Y Title: the label of the Y Axis
X Title: the Label of the X Axis
Main title: the title of the chart
Amount Label Orientation: select how the labels are displayed in the waterfall plot
X Label Color: select the color of the labels on the X axis
Color for positive values: self explanatory
Color for negative values: self explanatory
Split Label Line: whether the labels on X include a carriage return between words, or is displayed in a single line