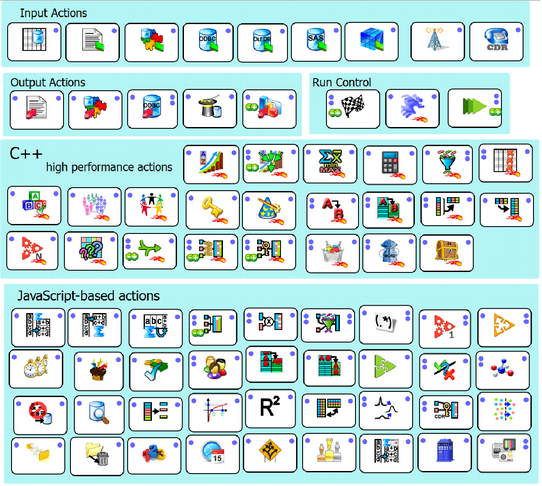
Inside Anatella, all the data transformations are represented as “small boxes”, also called “Actions” or nodes. Anatella-Actions always operate on tables: an Action takes one or several tables in input, performs some data-transformation, and gives one or several tables as output. All the Actions are accessible to the user from the right-side panel in the main Anatella Window. Here is a screenshot of some of the currently available Actions:
In the next sub-sections, we will study the graphical representation of an Action inside an Anatella-Data-Transformation-Graph.
4.2.1. Input / Output Specifications
An Action takes one or several tables as input, performs some data-transformation, and gives one or several tables as output. The number of input & output tables of an Action is graphically represented by the number of small blue dots on the left & right of the Action. These blue dots are named “pins”.
For example:
•Consider the following action: 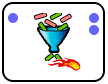
This Action takes one table as input, as represented by the unique pin on the left side of the Actions. This Action outputs two tables, as represented by the two pins on the right side of the Actions.
•Consider the following action: 
This Action takes 3 tables as input, as represented by the 3 pins on the left side of the Actions. This Action outputs one table, as represented by the unique pins on the right side of the Actions. The number of input table is not fixed and can be changed by clicking on the ![]() and
and ![]() icons.
icons.
4.2.2. Computing speed of the Action
The small flame ![]() icon means that the action is a highly-optimized action coded for speed in C++. For example:
icon means that the action is a highly-optimized action coded for speed in C++. For example:
•This Action is optimized for speed in C++: ![]()
•This is a “normal” Action coded in JavaScript: ![]() , in R:
, in R:![]() or in Python:
or in Python:![]()
•This is a (sub)Graph: 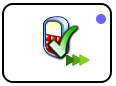
The Optimized-Actions that are developed in C++ (the ones that don’t have any Javascript ![]() , R
, R ![]() or Python
or Python ![]() logo). These optimized are running up to 100 times faster than the equivalent “normal” Actions developed in JavaScript/R/Python. See the section 9 to know how to create your own Javascript/R/python Actions.
logo). These optimized are running up to 100 times faster than the equivalent “normal” Actions developed in JavaScript/R/Python. See the section 9 to know how to create your own Javascript/R/python Actions.
The triple triangles ![]() icon means that this is actually not a single Action that will be executed but rather a complete (sub)Graph that might include many Actions (…and thus incur a very long running-time). See the sections 10.6. and 5.3.3. for more details. For example, when Anatella executes a (sub)Graph, you might see something like:
icon means that this is actually not a single Action that will be executed but rather a complete (sub)Graph that might include many Actions (…and thus incur a very long running-time). See the sections 10.6. and 5.3.3. for more details. For example, when Anatella executes a (sub)Graph, you might see something like:
4.2.3. Breakpoints
Anatella include a powerful debugger that allows you to “debug” the Actions based on JavaScript. The debugger starts only when you have placed some “break points” inside the “JavaScript source code”. This is illustrated in this way:
•This Action contains some active break points and the debugger will run: ![]()
•This Action contains some disabled break points: ![]()
The Anatella-debugger has one small limitation: You can debug only ONE Action at the same time. The Action that will be debugged is the one with the active break points.
4.2.4. Actions being edited
When you double-click on an Action, you obtain a window that allows you to set the different properties of the Action. Inside the Anatella-Graph window, you can always visually check which action is currently being “edited”: it’s the action with a green border. For example:
•The properties of this action are been edited: ![]()
•This action is not currently edited: ![]()
4.2.5. The Output pin being inspected
When you click on one output “pin” of an Action in “Run mode”, you directly see in the data-preview-window the data-table that is “outputted” on this pin. This is very useful when testing & debugging your transformation. Inside the Anatella-Graph window, you can always visually check which data-table you are viewing in the data-preview-window: it’s the table that corresponds to the pin with a green border. For example:
•This green ouput pin is the pin that is currently shown inside the Main Anatella data-preview Window: ![]()
4.2.6. Hard Drive Cache / Gel Files
Let’s assume that you are developing a very large transformation-graph containing dozens of Actions. One of these Actions requires extra-care because its parameters needs extra-tuning. You are forced to run several time this “difficult” Action before obtaining the correct values of its parameters. Let’s assume that this “difficult-to-tune” Action occurs at the “end” of the transformation graph: i.e. each time you want to test a new set of parameters for this “difficult” Action, you are forced to wait for a very long time because there are many, many other actions to run before executing the “difficult” action with the new parameters to test. In this somewhat common situation, it would be nice to “Save on the Hard Drive” a backup of all the input tables of this “difficult” Action. In this way, the next time that you run the “difficult” Action (with another set of parameters to test), you can directly use the backed-up tables, instead of re-running the whole transformation graph from the start. This “Hard Drive Backup” is commonly named a “HD (Hard Drive) Cache” or “Anatella Gel file”. An “Anatella Gel file” contains a complete “snapshot” of one table, frozen in time (...hence the name “Gel file” – gel means “freeze” in French).
The “Gel files” are extremely useful when developing new large and difficult transformations because it allows you to test very rapidly (nearly in real-time), many different parameters of your “difficult-to-tune” Actions.
Thanks to the unique automatic “HD cache” feature of Anatella, developing new complex transformation graphs is a “Child play”! The development time of large transformation-graph is usually divided by 10, compared to other ETL.
Inside the Anatella-Graph window, you can visually check which output pins have a corresponding “HD Cache”/”Gel File”: these are the output pins with an orange border: for example:
•This (orange) output pin possesses an “Anatella Gel File”:
![]()
•This (green) output pin possesses an “Anatella Gel File” and the content of this file is visible inside the data-preview-window:
![]()
•This (red) output pin does not accept any “Anatella Gel File” (any “HD Cache” files will be deleted as soon as the graph starts. This happens when using the advanced multi-threading execution techniques: see section 5.3.2.4):
![]()
When you are in “Run Mode” (i.e. when the ![]() button in the main toolbar is “checked”), you can:
button in the main toolbar is “checked”), you can:
•Create, for (nearly) any output pin, a new “Gel File”: Simply click on the required output pin.
•Click on any orange pin and instantaneously see the corresponding data-table in the data-preview-window. The preview is based on the available “Gel File” and appears instantaneously (it does not require any computation at all).
4.2.7. Action Status (OK/Error/Warning)
If an Action fails (because, for example, the Action parameters are invalid), then the background color of the action becomes light-red: for example:
oThis action failed: ![]() (background color is light red)
(background color is light red)
oThis action has some warnings: ![]() (background color is yellow)
(background color is yellow)
You can check the “Execution log” to know the precise nature of the failure or warning.