Inside Stardust, there are two different ways of computing the colours of all the points inside the 3D display: see section 5.2.14 about this subject. To summarize, these two different ways are:
1.The colours of the points are setup through the advanced 3D display “Group” manager. You can access this manager by selecting the “(Meta-)Groups” tab inside the “parameter window”: see section 5.3.1.2.
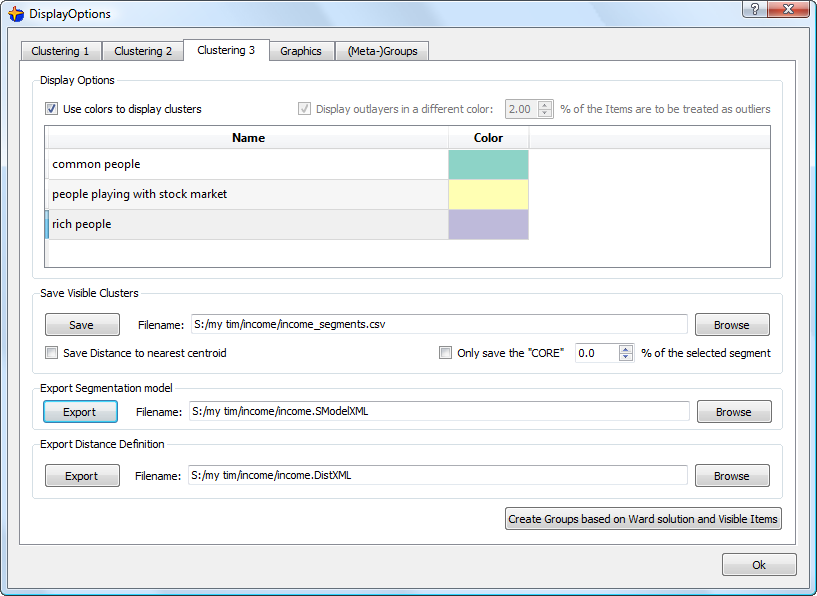
2.The colour of the points represents the different segments inside the population. You can configure the colour of each segment by selecting the “Segmentation 3” tab inside the “parameter window”:
The ![]() checkbox is completely equivalent to the
checkbox is completely equivalent to the ![]() button (see section 5.2.14 about the
button (see section 5.2.14 about the ![]() button).
button).
Inside the table on the “Segment 3” tab, you can:
•Click on the “Color” column to change the colour of each segment.
•Change the label of each segment.
| This label is used to describe the segments inside: |
oThe “segmentation model” (see section 5.5.6.)
oThe CSV file described inside the next section (5.5.5)