|
There are three ways to start the Config File Editor:
1. Create a new Config File using TIMi Modeler and open it directly after creation (this is normally what you just did) 2. Click the
3. Double-click on a “*.CfgXML” file inside an explorer window. |
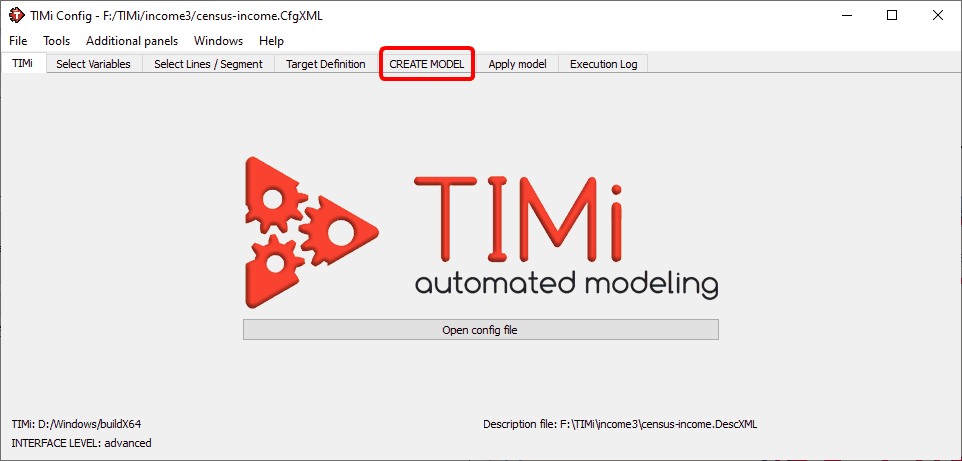
Here is an illustration of the “Config File editor”. You can directly Click on the “CREATE MODEL” tab:
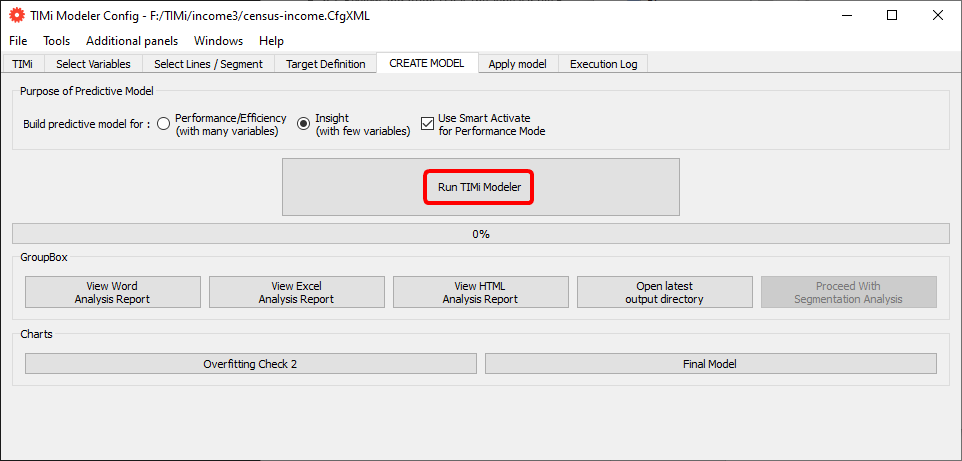
… then click on the “Run TIMi Modeler” button:
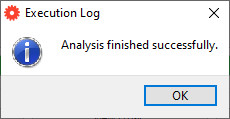
After a few seconds of computation, you should see this message:
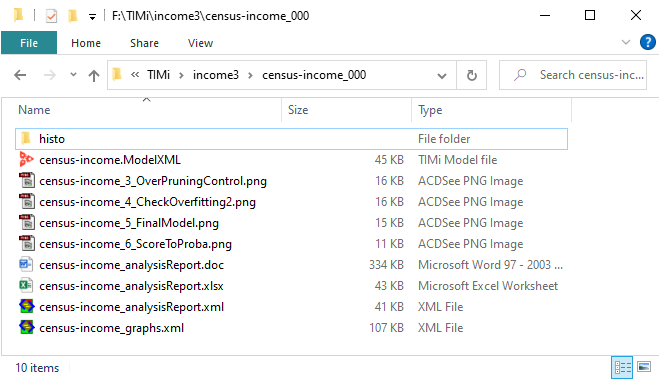
The working directory now contains one additional subdirectory named “census-income_000”: see the illustration below:
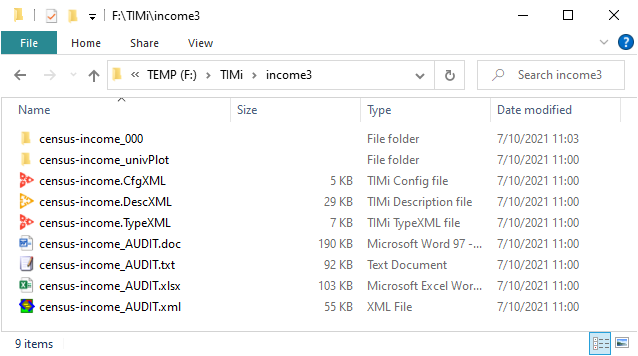
And now a small explanation about what just happened: We just asked TIMi Modeler to build a predictive model using all the lines and all the columns of our dataset. This newly created predictive model will be used to compute, for each individual in the dataset, the probability to be “inside the target” (to have an income level above $50K). The results of all these computations are stored inside the directory “demoIncome_000”:
The “census-income_analystReport.doc” and “census-income_analystReport.xml” files have the same content. The only difference between these files is: « Most of the time, the .doc file is the one you are interested in. The “.xml” is only useful for the automatic generation of commercial reports. ».
Let us have a look at the “census-income_analystReport.doc”:
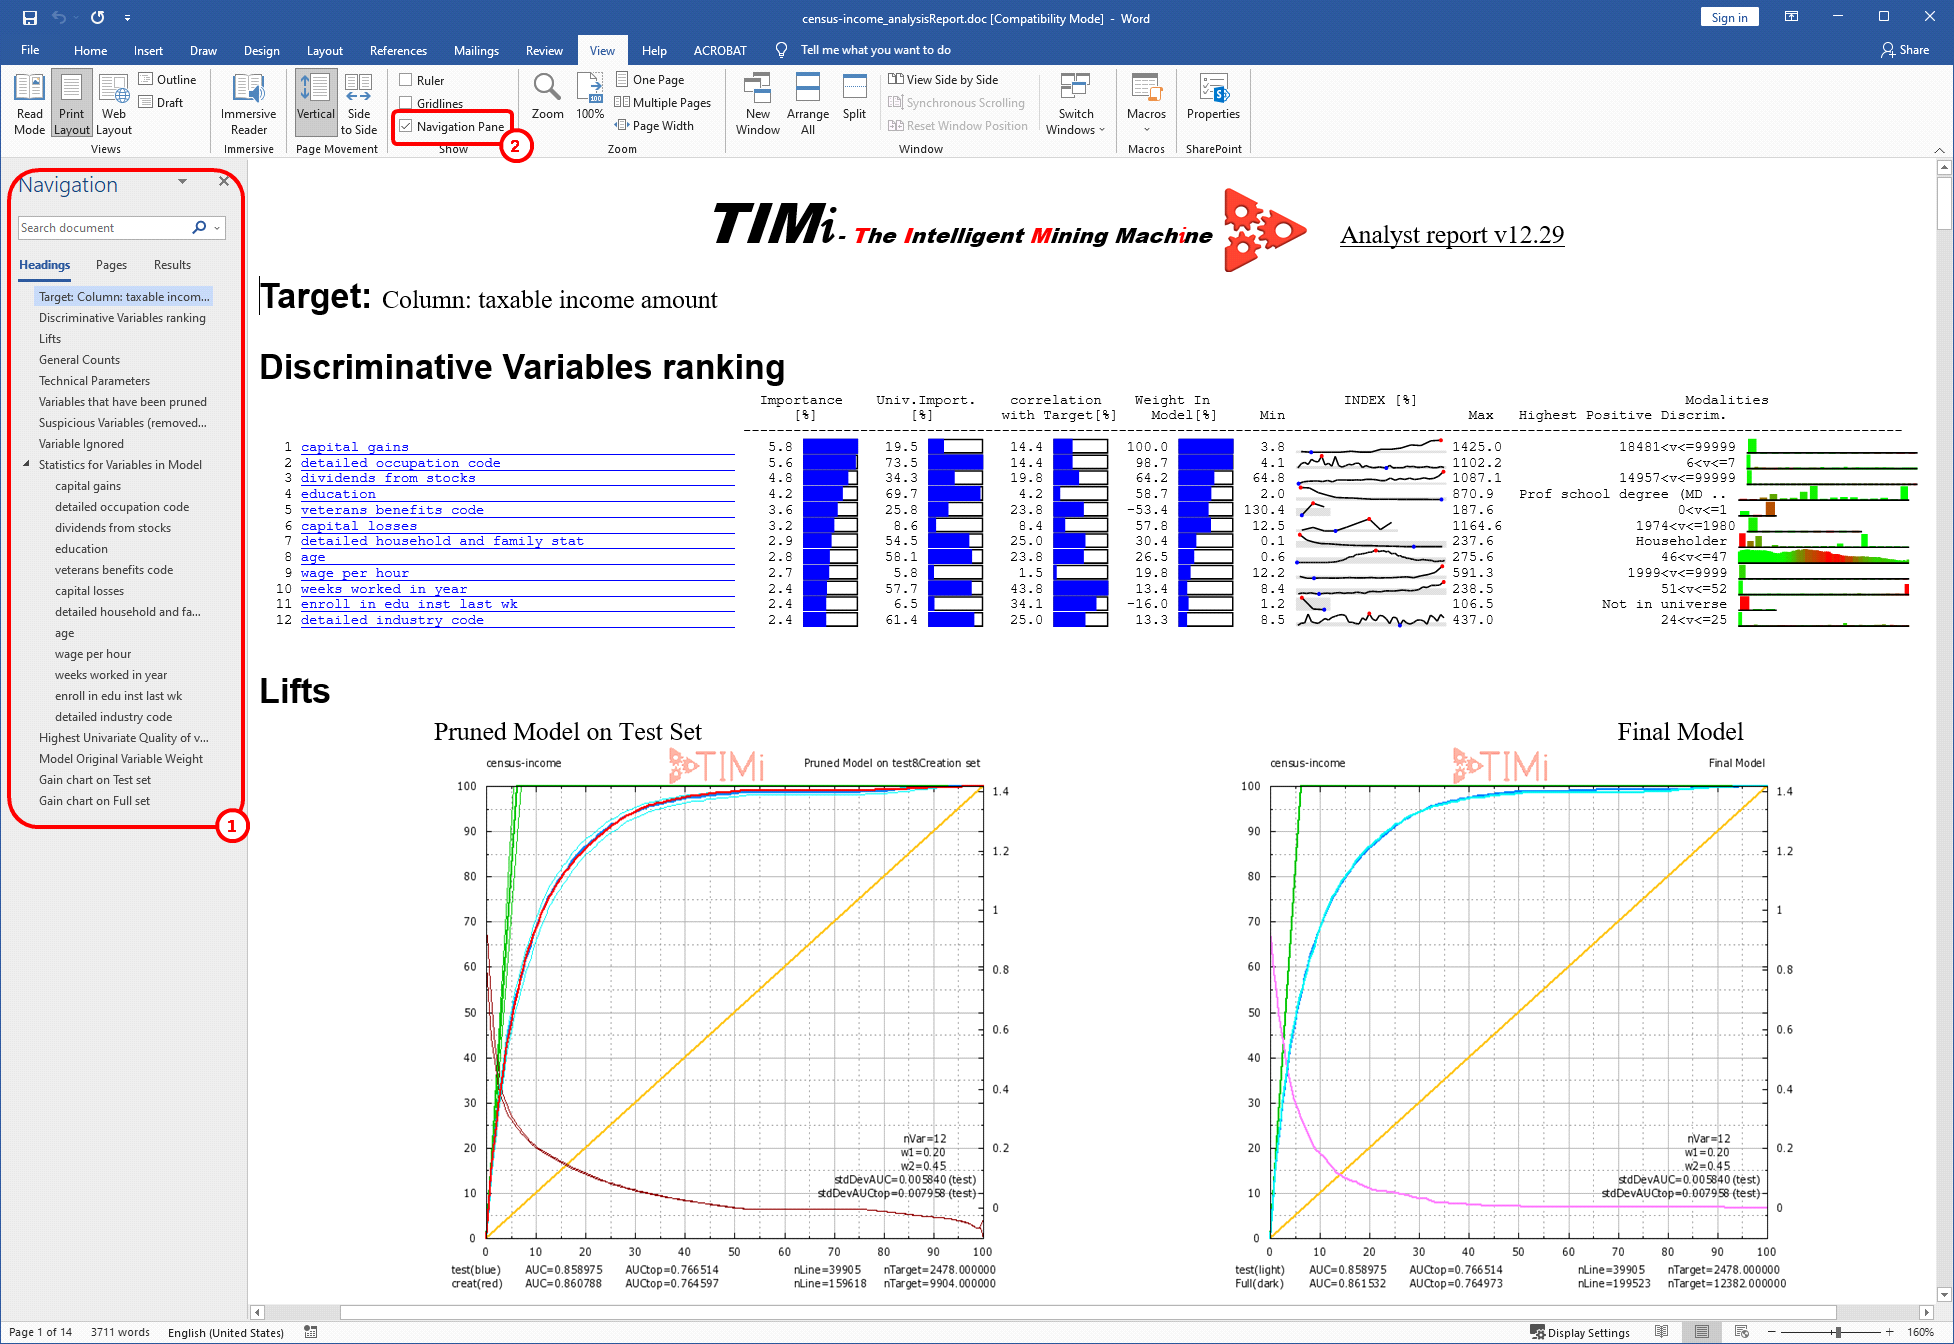
To see the left panel inside Microsoft Word here ![]() , click in the toolbar on the category menu “View” and then check the checkbox named “Navigation pane”:
, click in the toolbar on the category menu “View” and then check the checkbox named “Navigation pane”: ![]()
Let us see what are the best columns used to predict accurately the target. During a predictive modeling exercise, the columns of the dataset are sometimes referred as “variables”. Our predictive model does not use all the “variables” or “column” of our dataset to compute its prediction: i.e. It only uses 12 columns out of 42. Theses 12 columns have each a different importance: Some columns are *very* useful to predict the target, some other are nearly useless. Click in the “Document Explorer” panel on “Discriminative Variables ranking”. See illustration:
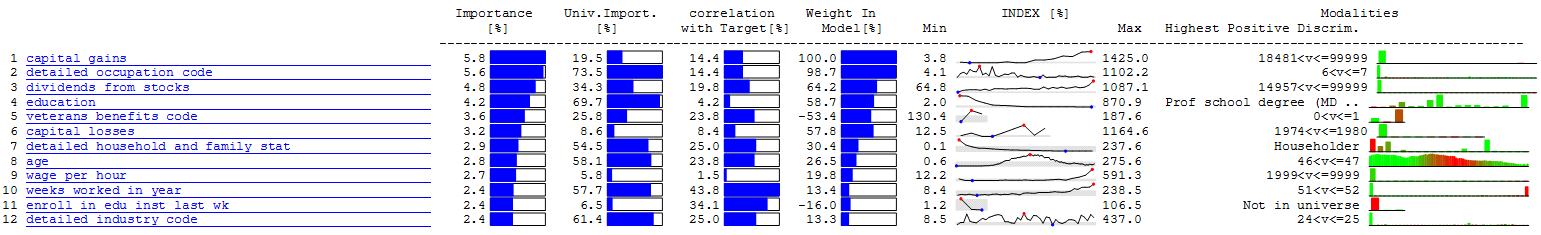
We can see that one of the best column to predict the target is “capital gains”. That’s not a surprise!
The variable “age” has a non-negligible importance. One possible interpretation of this high importance is that you have to wait to have the right age to be wealthy. Young people have very little chance to be wealthy.
Let us have a closer look at the variable “age” again:
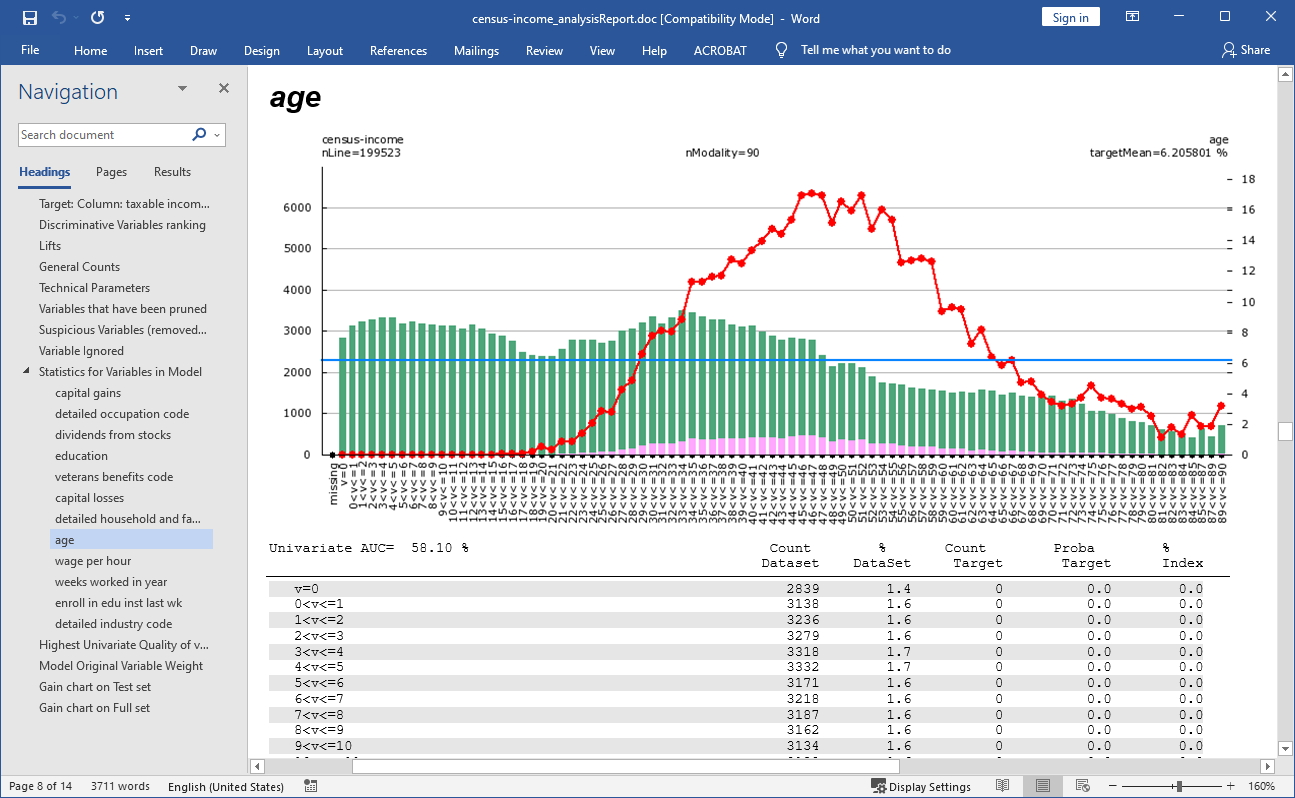
Note that TIMi Modeler has now decided that it needed to cut/discretize the variable “age” in 90 “bins” or “modalities” to obtain a good prediction accuracy (compare this with the chart of the “age” generated for the AUDIT report: we had only 15 modalities/bins).
Let us have a look at the quality of prediction of the model produced by Modeler! On the “Document Map”, click on the “Lifts” section. Look at the dark blue line.
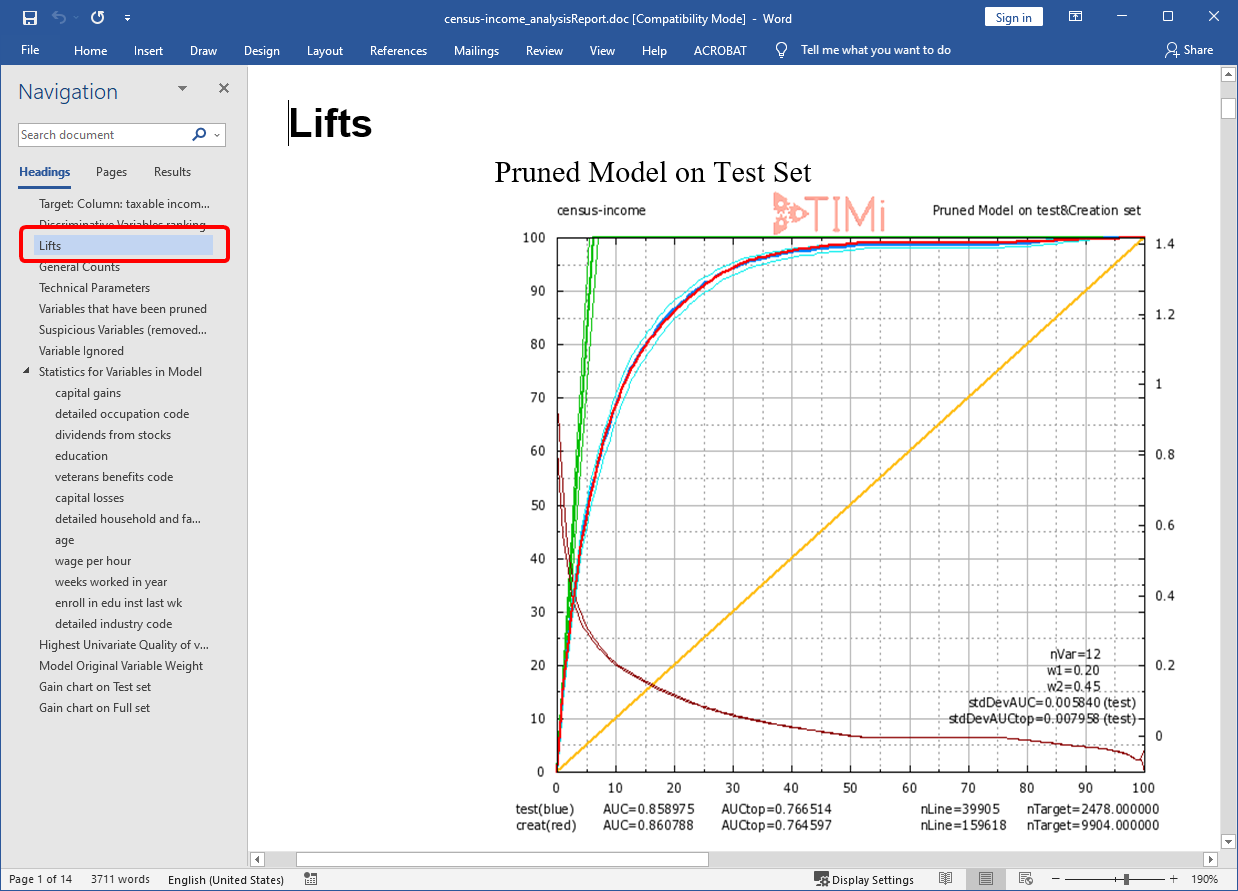
The model produced by TIMi Modeler has a AUC= 85.8% (on the test set). This is quite good. You can now close the “Microsoft Word” application (the file “demoIncome_analystReport.doc” was visible inside Microsoft Word).