Out of the lift chart, we can extract several indexes that characterize the accuracy of the predictive model.
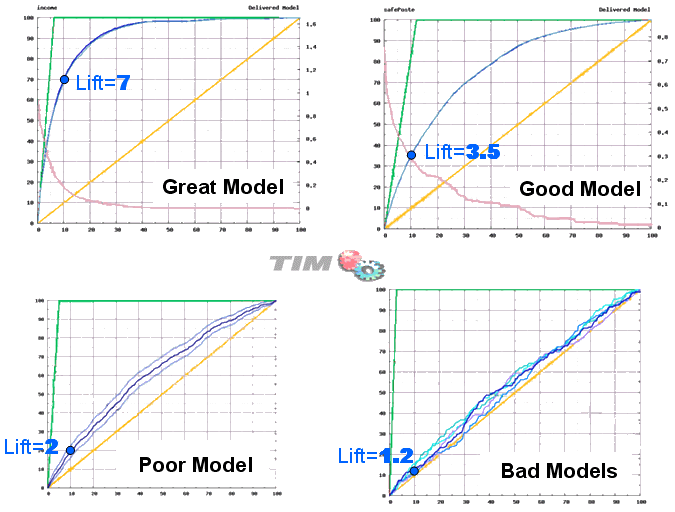
The most common index is the “lift index” or, in short, the “lift”. In the chart above, the “lift index” is 2.4 (=24/10): If we use our predictive model to select 10% of the population, our selection is 2.4 times better than the “random model” selection because we will "find" 24% of the targets (instead of only 10% of the targets for the “random model”). The “lift index” represents “how much better” you are doing compared to the “random model” selection. By convention, it is always expressed for a selection of 10% of the dataset. Here are some examples:
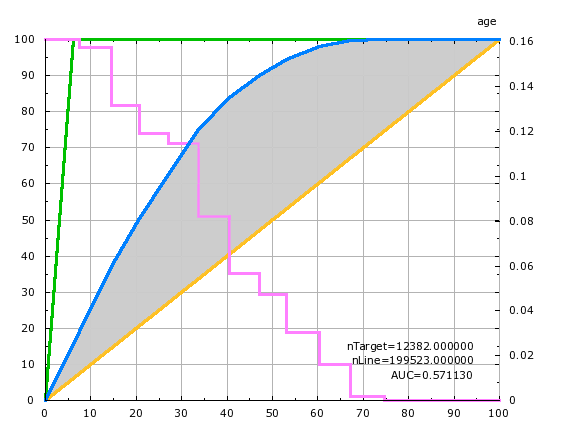
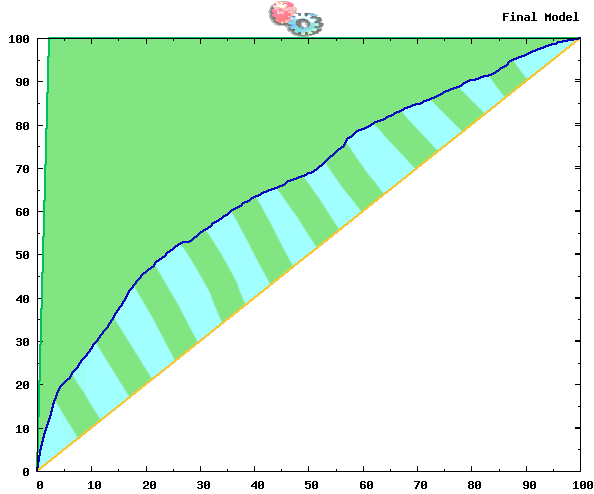
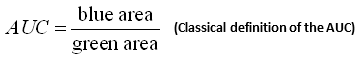
The “lift index” is very often used but it’s not very representative of the accuracy of the predictive model because it only represents one point of the lift curve (the point for the “10% selection”). There exists a better index named AUC: “Area Under Curve”. The AUC is the measure of the area “in between” the blue lift curve and the yellow line. This area is illustrated in grey in the following chart:
By definition, the AUC of the “perfect” predictive model is AUC=100%.
By definition, the AUC of the “random” predictive model is AUC=0%.
In the chart above, the AUC of the univariate predictive model built using the “age” variable is 57.1% (the area below the blue curve is 57.1% of the area between the green curve and the yellow line).
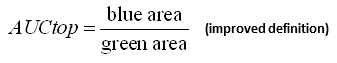
For many applications (e.g. cross-sell models, up-sell models, churn models), there is only one part of the lift curve that is of any interest: the very beginning of the lift curve, on the left. This is why, inside TIMi, we introduced a new notion named the “AUCtop”. Here is the definition of the “AUCtop”:
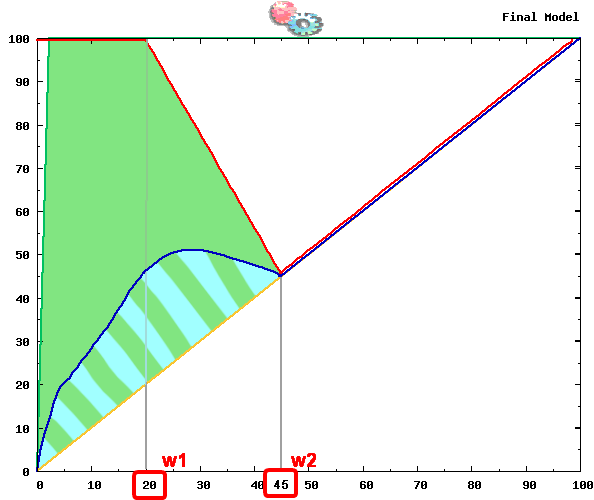
The “AUCtop” only appears inside the TIMi Modeler Analyst Reports: you won’t see it inside the Audit reports. The AUCtop of a model is defined using two parameters that are named “w1” and “w2”. These two parameters are defined inside the panel “Pruning” inside the “.CfgXML” editor (by default, this panel is hidden). To know more about the “AUCtop” of a predictive model, the parameters “w1” and “w2”, please refer to the TIMiModelerAdvancedGuide.pdf.