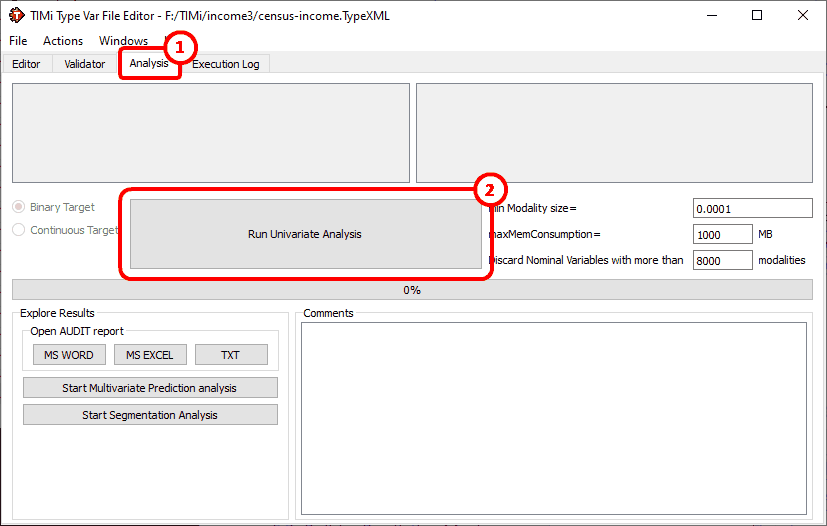
Click on the “Analysis” tab: ![]() …and then on the “Run Univariate Analysis” button:
…and then on the “Run Univariate Analysis” button: ![]()
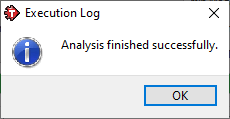
After a few seconds you obtain:
Your working directory now contains:
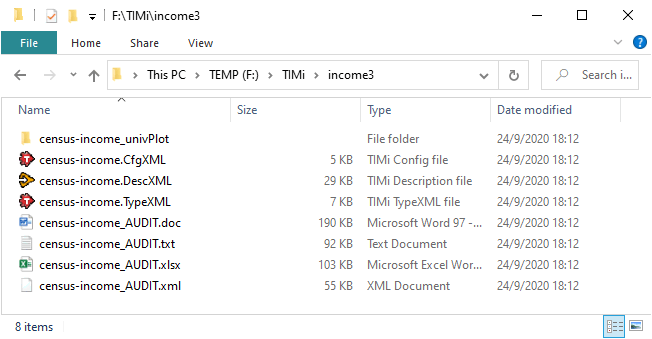
The “census-income.CfgXML” file will be described in the next section.
The “census-income.DescXML” file is required to do a segmentation and a prediction analysis. The “.DescXML” files are not editable and contain only information used internally by TIMi Modeler and StarDust. The “.DescXML” files contain information about the distribution and the recoding of the different variables that is required by TIMi Modeler and Stardust to correctly process the data.
The “census-income_AUDIT.doc”, “census-income_AUDIT.txt” and “census-income_AUDIT.xml” files have all the same content. The only difference between these files is: « Most of the time, the .doc file is the one you are interested in. The .txt file is faster to open but it does not contain any images. The “.xml” is only useful for the automatic generation of commercial reports. ». Let us have a first look at our dataset! Click on the “MS-Word” button here:
This button is a simple shortcut to open the .docx file. Alternatively, you can double-click on the “census-income_AUDIT.doc” file!
You should see something like this inside Microsoft Word:
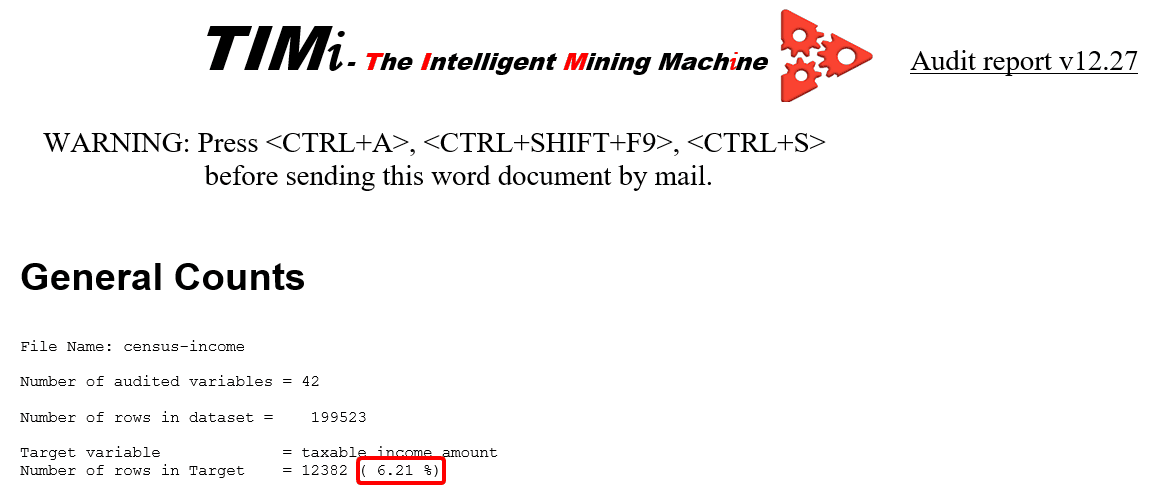
The important information here is the percentage of target inside the dataset: 6.21%. It means that if you pick at random a row (a person) inside your dataset, you have 6.21% of chance of to find somebody that is a target (i.e. that has an income level above $50K). “6.21%” is named the “a priori probability” (to be a Target) or “natural density” of targets.
Let us scroll down a little inside the AUDIT document. Let us look at the information extracted from the column “age”. You can use the “Navigation Panel” to directly access the variable “age”. You should see the following:
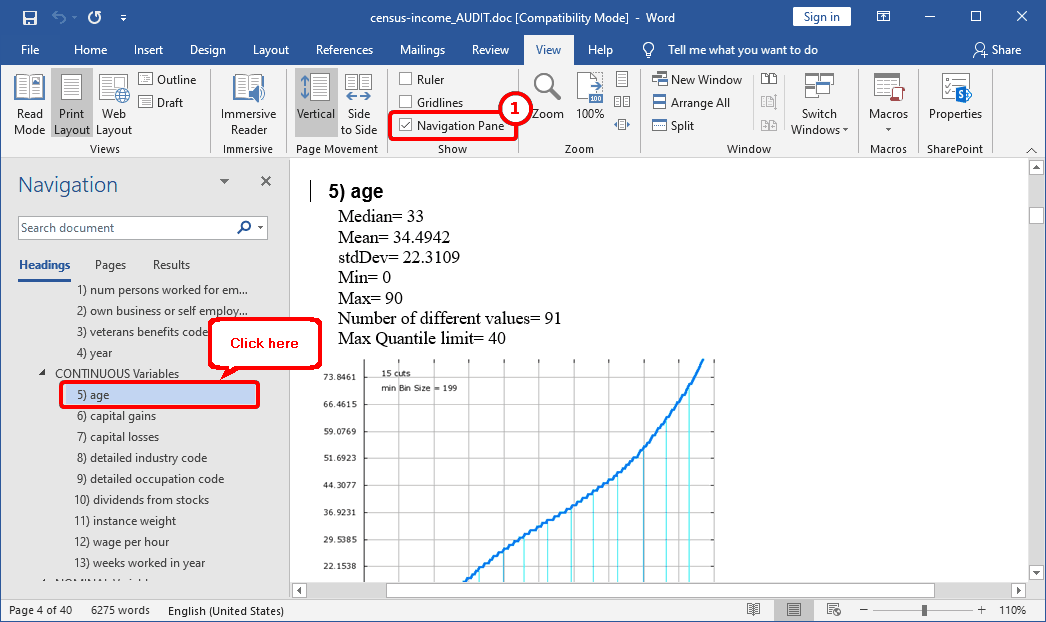
If the “Navigation Panel” is not visible, you can activate it in the “View” menu by clicking here: ![]()
When you scroll down a little further, you see a red/green histogram chart.