When your data scientists are managing sensitive data stored inside a database, you need to closely monitor their actions to prevent any catastrophic event that might jeopardize the confidentiality of the data (or even damage your database!). To handle this delicate situation properly, you might be interested in logging all the SQL commands that were sent to your databases. These “SQL logs” are usefull to make data scientist accountable for all their actions that are related to your sensitive databases. This section explains how to activate the “SQL logging” mechanism included inside Anatella.
A typical sequence found inside these logs is the following 4 rows:

Here is a small explanation on the meaning of each of the 4 above rows:
Row 1: The user clicked on the Pin 0 of the “readODBC” action (with id=1) to start the execution of the Anatella graph named “f:/testLogging.anatella”.
Row 2: The “readODBC” action (with ActionID=1) started the execution of the SQL command “select * from income”. This returned a table with 43 columns.
Row 3: The “readODBC” action (with id=1) extracted 10 rows out of the database.
Row 4: The execution of the Anatella graphed stopped at 17:58:33 on the 2020/4/5.
The columns of the “AnatellaLogs” table are:
•ID: A primary key that uniquely identifies the row
•ProgramID: The ID of the tool that initially created the row. The ID’s are: Anatella=0, Modeler=1.
•PID: This is the “Process ID”: it’s an identifier that uniquely identifies the Anatella process that created the row (in the possibly case when there are several Anatella instances running simultenously on the same server/host).
•Host: This is the (Windows) name of the server that generated the row inside the AnatellaLogs table.
•User: This is the (Windows) name of the ysed that generated the row inside the AnatellaLogs table.
•Graph: This is the filename of the .anatella graph file that generated the row inside the AnatellaLogs table.
•Date: Self-explaining.
•SeverityCode: This is a number that refers to this table:
SeverityCode |
Meaning |
0 |
SUCCESS |
1 |
ERROR |
2 |
WARNING |
3 |
INFO |
4 |
DEBUG |
•ActionName: The name of the Action inside your .anatella graph file that generated the row inside the AnatellaLogs table.
•ActionID: The ID of the Action inside your .anatella graph file that generated the row inside the AnatellaLogs table.
•MessageText: A description of the event represented by the current row inside the AnatellaLogs table.
•Optional: empty/null (possible usage in future extension).
Inside Anatella, all the SQL commands are logged. This means that Anatella is logging each execution of the readDOBC action, the upsertODBC action, the createTable action, the teradataWrite action and the OracleOCI action.
The steps required to activate the logging mechanism included inside Anatella are:
1.Request a serial number (i.e. a license) where the “SQL Logging” option is enabled. Please contact your TIMi sales representative to request your new serial number with this special option. The sections 7.4.2., 7.4.3 and 7.4.4 explain how to enter your new serial number.
2.Create inside your database a table named “AnatellaLogs”: i.e. run the following SQL command inside your database:
CREATE TABLE AnatellaLogs (
ID INTEGER NOT NULL PRIMARY KEY AUTOINCREMENT,
ProgramID INTEGER NOT NULL,
PID INTEGER NOT NULL,
Host nvarchar(100),
User nvarchar(100),
Graph nvarchar(300),
Date nvarchar(20),
SeverityCode INTEGER NOT NULL,
ActionName nvarchar(20),
ActionID INTEGER NOT NULL,
MessageText TEXT NOT NULL,
Optional TEXT
);
![]()
Inside the above “CREATE TABLE’ statement, the columns “ID” and the column “Optional” are not required: you can omit/remove them.
3.Create inside your database a database-user named “AnatellaLogs” that can only “INSERT” new rows inside the “AnatellaLogs” table. In particular, the “AnatellaLogs” user should not be authorized to DELETE ROWS or UPDATE ROWS from the “AnatellaLogs” table (otherwise an ill-intentioned user might be tempted to corrupt the “AnatellaLogs” table to “cover its traces”).
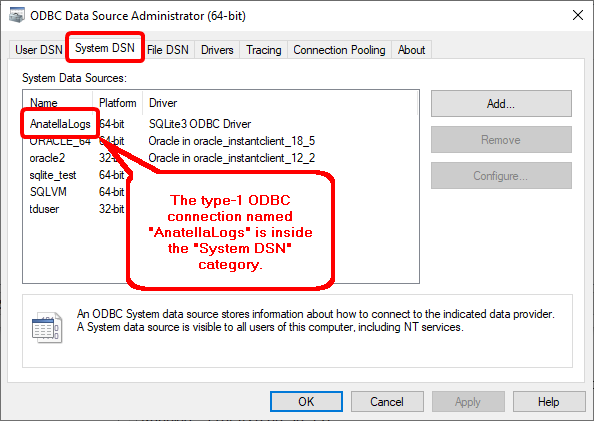
4.Create on the local machine a type-1 ODBC connection to your database that is named “AnatellaLogs”. This is important that this new type-1 ODBC connection is inside the “System DSN” category because this prevents a non-adminstrative user to temper with the ODBC connection:

![]()
Please, pay attention to the ODBC manager: If you are using a 64-bit version of Anatella, you need to use the 64-bit ODBC manager. Likewise, if you are using a 32-bit version of Anatella, you need to use the 32-bit ODBC manager. You’ll find more details on this subject inside the section 5.1.6.1.
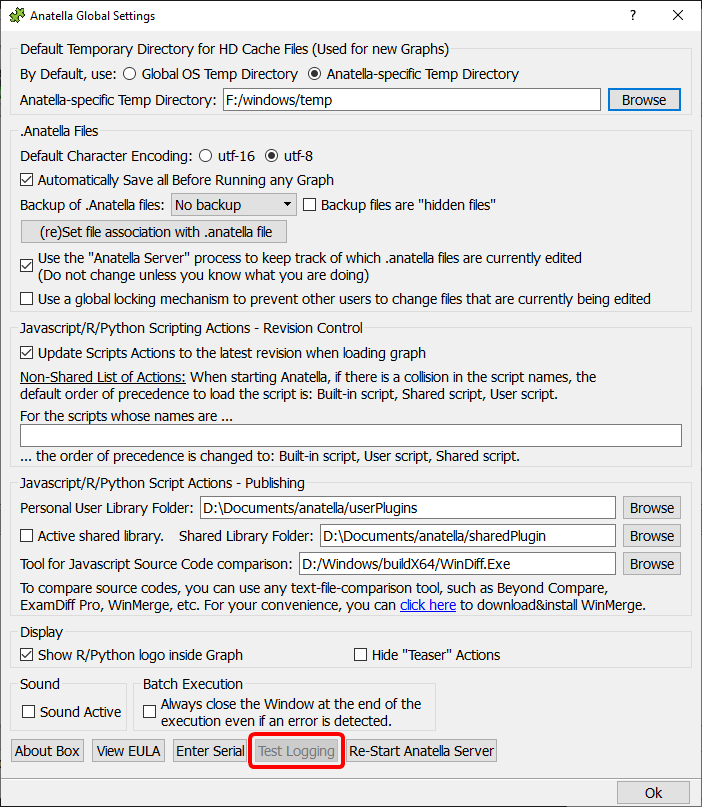
5.Test your setup: To run a simple quick test, you can click the “Test Loggin” button here:

![]()
If the “Test Logging” button is disabled (i.e. grayed out, as in the example above), it means that you forgot to request a serial number with the “SQL Logging” option that is enabled (see step 1).
After clicking the “Test Logging” button, you should see a new row inside the “AnatellaLogs” table inside your database. This new row looks like this:

For your convenience, to run a quick test, you’ll find a sqlite database with a proper “AnatellaLogs” table already pre-configured inside the file “<TIMi_install_dir>/bin/AnatellaLogs.sqlite”. This sqlite database is only useful for a quick test: i.e. it should NEVER be used in a production setting because of one limitation of the sqlite database engine: i.e. The sqlite database engine does not handle user rights: i.e. All sqlite users can DELETE ROWS from a sqlite database (and, in our case, this should be forbidden: For more details, see the step 3, here above). A good database engine to store the “AnatellaLogs” table is MS-SQLServer, Oracle, Postgres, etc. You’ll find the ODBC drivers for SQLite databases here: http://download.timi.eu/ODBC/ODBC_drivers_SQLite/