Icon: ![]()
Function: parallelRun
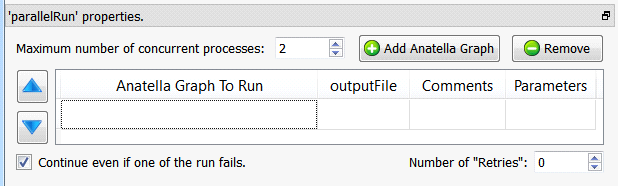
Property window:
Short description:
Runs one or several Anatella (sub)Graphs.
Long Description:
Runs sequentially (When the parameter “maximum number of concurrent processes” is one) or in parallel (When the parameter “maximum number of concurrent processes” is two or more) several Anatella Graphs.
For large data-transformation, it can be interesting to divide all the transformations to perform into several graphs. Division is interesting for several reasons:
a)It allows you to better organize your work.
b)It allows easier collaboration between a team of different data miners (each one working on a different set of Anatella graphs).
c)It’s an easy way to create synchronization-barriers: See section “5.3.2.6 Thread Synchronization”.
d)It’s an easy way to run the same data transformation inside a “loop” (with some “loop-variable” passed as parameter of the graph).
e)It’s an easy way to monitor the success (or the failure) of each of your Anatella graphs (e.g. looking at the output table of the ![]() ParallelRun Action, you can automatically send an email to a site administrator, in case of failure).
ParallelRun Action, you can automatically send an email to a site administrator, in case of failure).
f)It allows you to use more than 2GB RAM on a 32-bit OS (on a 32-bit OS, each different process can use maximum 2GB RAM, but you can have several processes running at the same time).
g)It’s an easy way to reduce computation time, running in parallel several independent Anatella graphs.
If you want to use in parallel the many CPU’s available on your computer, you can use the ![]() Multithread Action or the
Multithread Action or the ![]() ParallelRun Action.
ParallelRun Action.
Let’s take a small example:
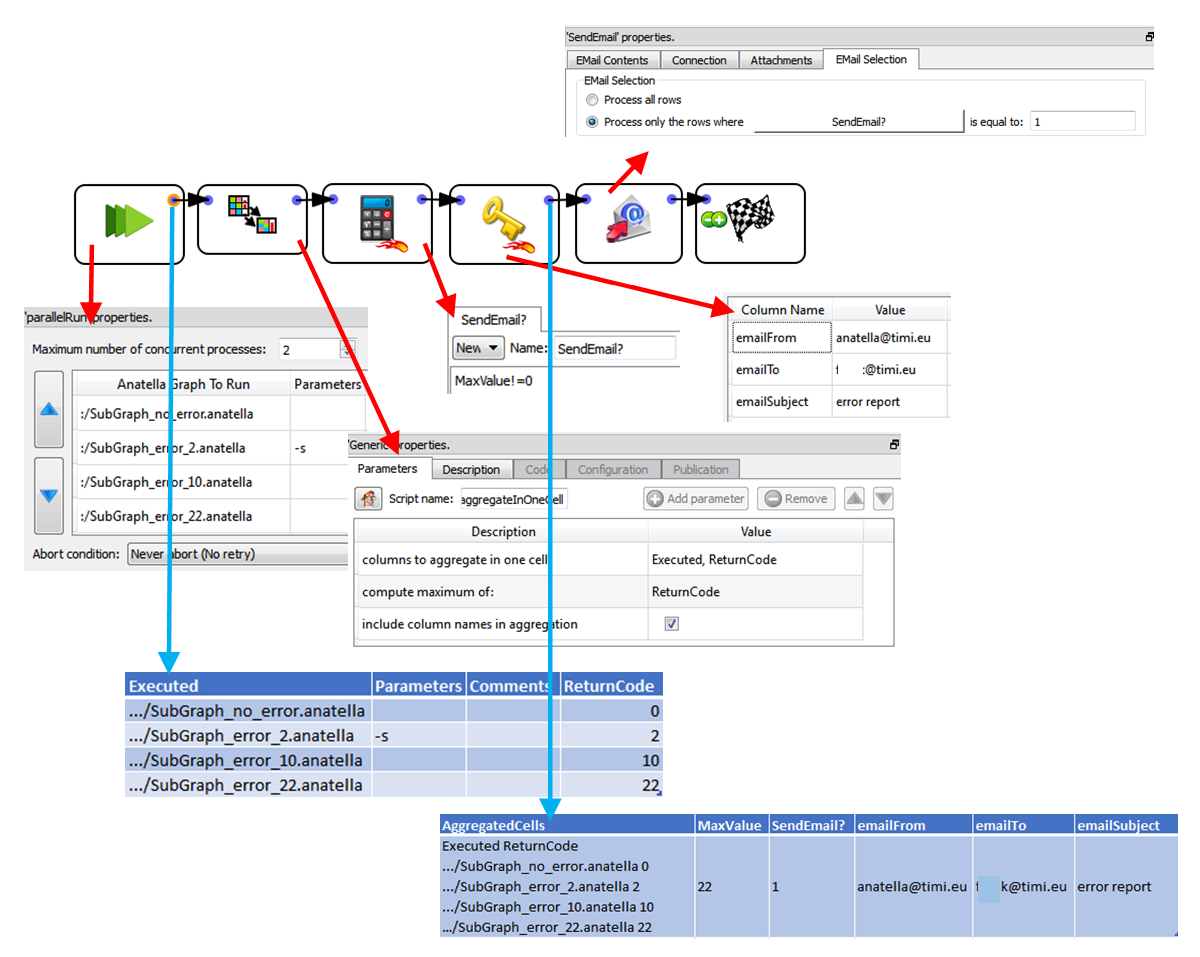
The above example graph will send an email to the system administrator if an error (or a warning) is detected during the execution of one of the Anatella-Graphs launched by the ![]() ParallelRun Action.
ParallelRun Action.
How does this work? The ouput of the ![]() ParallelRun Action is a table that contains the final “error level” returned after the execution of each of the Anatella-Graphs (See section 4.7. to know more about “error levels”). We look at all the “error levels” returned by the
ParallelRun Action is a table that contains the final “error level” returned after the execution of each of the Anatella-Graphs (See section 4.7. to know more about “error levels”). We look at all the “error levels” returned by the ![]() ParallelRun Action and we send an email if there exists a non-null “error level” (because a non-null “error level” signals an error or a warning during the execution of the Anatella-Graph). We could have achieved the same result using only Javascript: i.e. using the ProcessRunner Javascript Class and the SendMail Javascript Class.
ParallelRun Action and we send an email if there exists a non-null “error level” (because a non-null “error level” signals an error or a warning during the execution of the Anatella-Graph). We could have achieved the same result using only Javascript: i.e. using the ProcessRunner Javascript Class and the SendMail Javascript Class.
When you run the above example graph, the ![]() ParallelRun Action launches the simultaneously execution of two Anatella-Data-Transformation-Graphs out of the 4 Anatella-Graphs to execute (because the parameter “maximum number of concurrent processes” is two). As soon as one of the 2 running Anatella-Graph are finished, Anatella directly launches the next Anatella-Graph, so that there are always at least two Anatella-Graphs running at the same time. Internally, to launch the execution of the first graph, Anatella will run (you can see that line in the log-file window of Anatella):
ParallelRun Action launches the simultaneously execution of two Anatella-Data-Transformation-Graphs out of the 4 Anatella-Graphs to execute (because the parameter “maximum number of concurrent processes” is two). As soon as one of the 2 running Anatella-Graph are finished, Anatella directly launches the next Anatella-Graph, so that there are always at least two Anatella-Graphs running at the same time. Internally, to launch the execution of the first graph, Anatella will run (you can see that line in the log-file window of Anatella):
Anatella.exe -e sub_graph_no_error.anatella
When the parameter “maximum number of concurrent processes” is one, the Anatella graphs are executed sequentially in the exact order given by the user. When the parameter “maximum number of concurrent processes” is greater than one, the order in which the graphs are executed is not fixed (i.e. it’s partially random).
Inside the “Parameters” field of the ![]() ParallelRun Action, you can pass some “initialization” parameters to the Anatella graph that will be launched. These “initialization” parameters are typically “Global Parameters”: see section 4.7.1. to know how to define “Global Parameters” on the command-line (and also section 9.4.2.). If the “Parameters” field starts with a “>” character, then it contains a javascript program that computes a string that is used to define the “Parameters”. For example:
ParallelRun Action, you can pass some “initialization” parameters to the Anatella graph that will be launched. These “initialization” parameters are typically “Global Parameters”: see section 4.7.1. to know how to define “Global Parameters” on the command-line (and also section 9.4.2.). If the “Parameters” field starts with a “>” character, then it contains a javascript program that computes a string that is used to define the “Parameters”. For example:
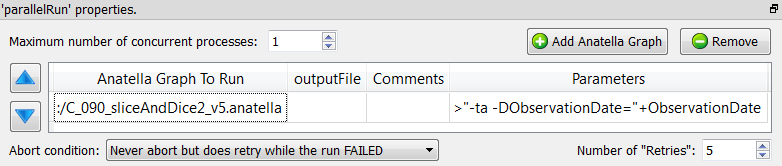
This will run the Anatella graph “C_90_sliceAndDice2_v5.anatella” with the 2 command-line parameters: “-ta” (that creates a trace files) and “-DObservationDate=…” (that re-defines the value of the Graph-Global-Parameter “ObservationDate” that is used inside the “C_90_sliceAndDice2_v5.anatella” graph). Note that to compute the value of the “ObservationDate” parameter we used the value of the current “ObservationDate” Graph-Global-Parameter: We are, in fact, “propagating” the value of the “ObservationDate” Graph-Global-Parameter to the child process (i.e. to the “C_90_sliceAndDice2_v5.anatella” graph).
When you click the ![]() STOP button, Anatella automatically aborts all the child processes that were running (i.e. You don’t need to “manually” abort each of the possibly many child processes currently running). For example, when you click the
STOP button, Anatella automatically aborts all the child processes that were running (i.e. You don’t need to “manually” abort each of the possibly many child processes currently running). For example, when you click the ![]() STOP button during execution of the above example graph, it will abort the current “main” graph but also the 4 other graphs: “SubGraph_no_error.anatella”, “SubGraph_error_2.anatella”, “SubGraph_error_10.anatella”, “SubGraph_error_22.anatella”.
STOP button during execution of the above example graph, it will abort the current “main” graph but also the 4 other graphs: “SubGraph_no_error.anatella”, “SubGraph_error_2.anatella”, “SubGraph_error_10.anatella”, “SubGraph_error_22.anatella”.
The ![]() ParallelRun Action has also a parameter named “Abort Condition”. This parameter can have the following values:
ParallelRun Action has also a parameter named “Abort Condition”. This parameter can have the following values:
•Never abort (No retry)
•Never abort but does retry while the run FAILED
•Abort if the run still FAILED after some retry
•Abort if the run had still a WARNING after some retry
To detect a FAILURE or a WARNING during a graph execution, Anatella uses the “error level” of the process: See section 4.7. to know more about “error levels”.
The typical usage of the option “Abort if the run still FAILED after some retry” is to to execute a FTP file transfer (e.g. using curl). Such type of task can easily fail. Failure is detected and Anatella re-attempt a new FTP file transfer (the maximum number of attempt is specified using the parameter “number of retries”).
Let’s now assume that you are re-using all the time the same (sub)Graph. In such situation, you want to:
1.…place this (sub)graph inside a specific location on your hard drive (i.e. your graph library), to be sure to always be able to access it.
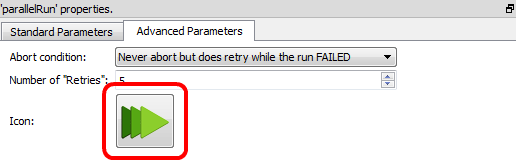
2....associate with this graph a specific icon, so that you can directly visualize, inside your data-transformation-graph, the call to your specific (sub)Graph. To associate an icon to the execution of a specific (sub)Graph, click here:
3.… and select a .png file.