Icon: ![]()
Function: SumOnRows
Property window:
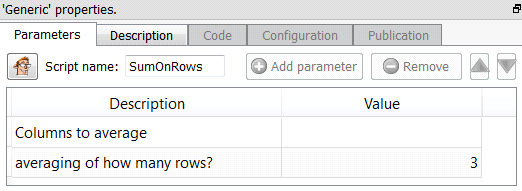
Short description:
Sum n rows.
Long Description:
This Action can be summarized as a "group by" 'n' consecutive rows Action.
Let's assume that:
•You want to create a chart in excel that represents the average SALES amount per week.
•you have an original table that contains, for each day, the SALES amount:
+--------------------------+
| ORIGINAL TABLE |
+--------------+-----------+
| DATE| DAY SALES |
+--------------+-----------+
|June 1, 2010 | 1500 $|
|June 2, 2010 | 1500 $|
|June 3, 2010 | 1500 $|
|June 4, 2010 | 5000 $|
|June 5, 2010 | 1500 $|
|June 6, 2010 | 1500 $|
|June 7, 2010 | 1500 $|
|June 8, 2010 | 2000 $|
|June 9, 2010 | 2000 $|
|June 10, 2010 | 2000 $|
|June 11, 2010 | 2000 $|
|June 12, 2010 | 2000 $|
|June 13, 2010 | 2000 $|
|June 14, 2010 | 2000 $|
+--------------+-----------+
i.e. You want to obtain the following table, to be able to create your chart:
+-------------------------------------------------+
| TRANSFORMED TABLE |
+--------------+----------------------------------+
| DATE| AVERAGE DAY SALES FOR THIS WEEK |
+--------------+----------------------------------+
|June 1, 2010 | 2000 $|
|June 8, 2010 | 2000 $|
+--------------+----------------------------------+
The objective of this operator is to obain the final "TRANSFORMED TABLE" based on the "ORIGINAL TABLE".
![]()
NOTE:
This operator is mainly useful when you want to reduce the number of rows of a table to obtain a "synthetized" version that is more suitable for visualization. In normal situation, this operator should not be used in conjunction with a predictive analysis because the "TRANSFORMED TABLE" contains a lot less information compared to the "ORIGINAL TABLE" and will usually generate less accurate predictive models.