|
<< Click to Display Table of Contents >> Navigation: 5. Detailed description of the Actions > 5.12. TA - R Predictive > 5.12.1. Multivariate Outlier Detection (
|
Icon: ![]()
Function: R_MAH
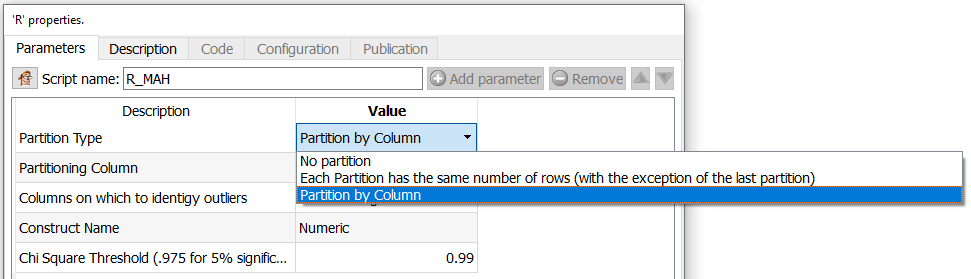
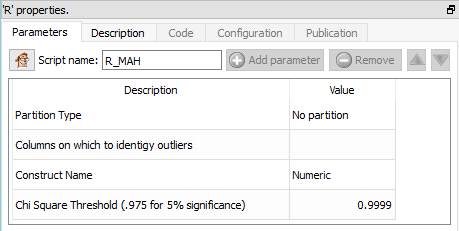
Property window:
Short description:
Identifies outliers in a dataset.
Long Description:
Identifies outliers in a dataset using the Mahalanobis distance projected on a Chi-squared distribution.
The Mahalanobis distance is an absolute number starting at 0 at the center of the multivariate distribution, and the distance is weighted by the covariance matrix in order to include the density into the equation. The largest the distance, the most likely a point is an outlier.
The Chi-Squared test gives a statistical threshold to flag outliers. On sample, the value is typically 0.9999 (we reject outliers if they have less than 0.01% probability of belonging to the multivariate distribution).
Special Note on Partition:
In many situations, outliers are not that meaningful on the total population. For example, some price levels are only outliers if take per product categories, consumption is often region specific, etc. To perform such analysis, simple set a partition to your variable of interest, and Mahalanobis distance will be computed in a single operation on all different categories. Note that the data must be sorted by the partition variable before.