|
<< Click to Display Table of Contents >> Navigation: 5. Detailed description of the Actions > 5.12. TA - R Predictive > 5.12.13. C50 (
|
Icon: ![]()
Function: R_C50
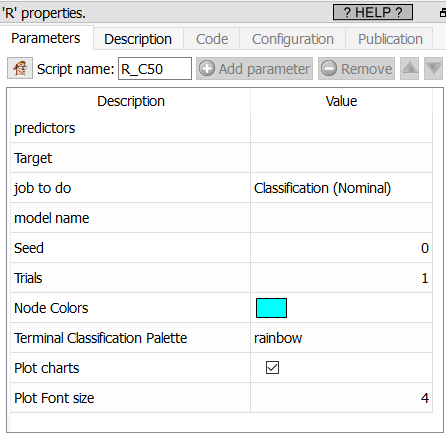
Property window:

Short description:
Build a C50 model.
Long Description:
C50 models are included for completeness and educational purpose, In pretty much all situations, you will prefer to use a CRT model.
In theory, C50 sounds like an attractive model as it can have any number of branches and appears to give models with higher accuracy.
In practice, C50 are much slower and hungry in resources, and you will need to select a sample in order to build a simple model on 200.000 rows. C50 also have a bad tendency to overfit the data, thus creating accurate but unreliable models.
C5.0 algorithm is an extension of C4.5 algorithm. C5.0 is the classification algorithm which applies in big data set. C5.0 is better than C4.5 on the efficiency and the memory. C5.0 model works by splitting the sample based on the field that provides the maximum information gain. The C5.0 model can split samples on basis of the biggest information gain field. The sample subset that is get from the former split will be split afterward. The process will continue until the sample subset cannot be split and is usually according to another field. Finally, examine the lowest level split, those sample subsets that don’t have remarkable contribution to the model will be rejected.
Gain is computed to estimate the gain produced by a split over an attribute
Let S be the sample:
▪Ci is Class I; i = 1,2,…,m
I(s1,s2,..,sm)= - Σ pi log2 (pi)
▪Si is the no. of samples in class i
▪Pi = Si /S, log2 is the binary logarithm
▪Let Attribute A have v distinct values.
▪Entropy = E(A) is
Σ{(S1j+S2j+..+Smj)/S}*I(s1j,..smj) j=1
▪Where Sij is samples in Class i and subset j of Attribute A.
I(S1j,S2j,..Smj)= - Σ pij log2 (pij)
▪Gain(A)=I(s1,s2,..,sm) - E(A)
Gain ratio then chooses, from among the tests with at least average gain, The Gain Ratio= P(A)

Gain Ratio(A)= Gain(A)/P(A)
(International Journal of Engineering Research & Technology (IJERT) Vol. 1 Issue 4, June - 2012 ISSN: 2278-0181)
Parameters:
Predictors: select the variables to use as predictors. You may mix numerical and text variables (remember to set the numeric variables to KEY or FLOAT with the “cast” action)
Target: set the target variable
Job to do: classification (nominal) or Regression (continuous)
Model Name: set the file name in which to save the rModel for scoring
Seed: set a number to generate random seeds
Trials: Enable a boosting procedure, this method is more similar to AdaBoost than to more statistical approaches such as stochastic gradient boosting.
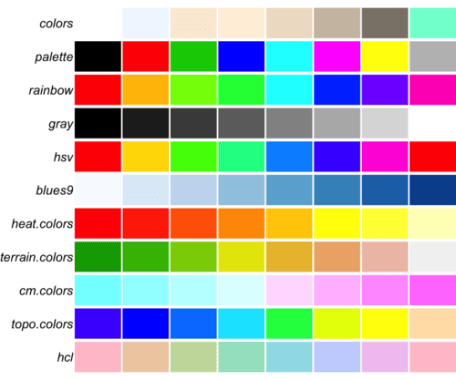
Node Color:

Plot charts: true/false
Include Prediction: Create a column with predicted classification or value.