|
<< Click to Display Table of Contents >> Navigation: 5. Detailed description of the Actions > 5.11. TA - R Visualization > 5.11.8. Cloud of Words (
|
Icon: ![]()
Function: R_CloudOfWords
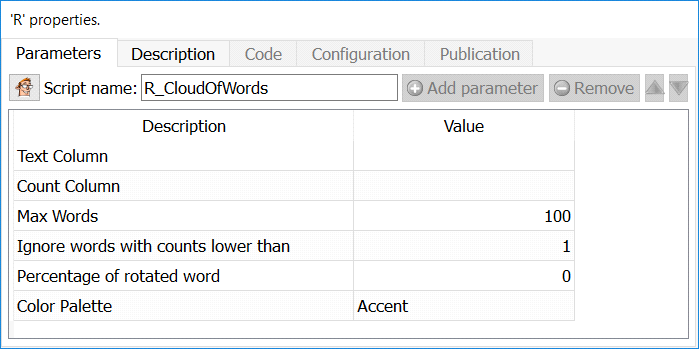
Property window:
Short description:
Generates a cloud of words based on text data.
Long Description:
Generates a cloud of words based on text data.
Text Column: the column with the word information
Count Column: the column with the frequency of occurrence of the word
Max Words: Maximim of different words to display
Ignore words with counts lower than: min threshold to display in the chart
Percentage of rotated words: percentage of words that will be displayed vertically
Color Palette: choose color scheme.
There are two ways of using this visualization:
1.Generate account of occurrence of preset text}
2.Generate a count of occurrence of words in open text.
The first one is straight forward: simply use an aggregate and extract the count, for example, let’s explore the education level in the Census Income database a bit differently. We simply use Aggregate on Education, and select the Count
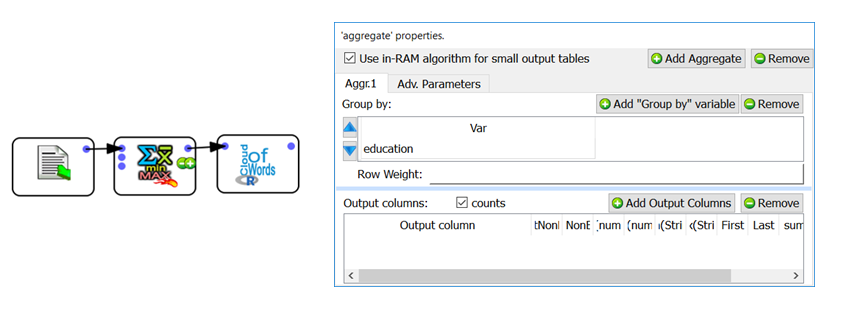
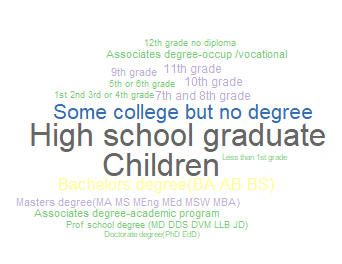
We then send the information to the Cloud of Word and we have:
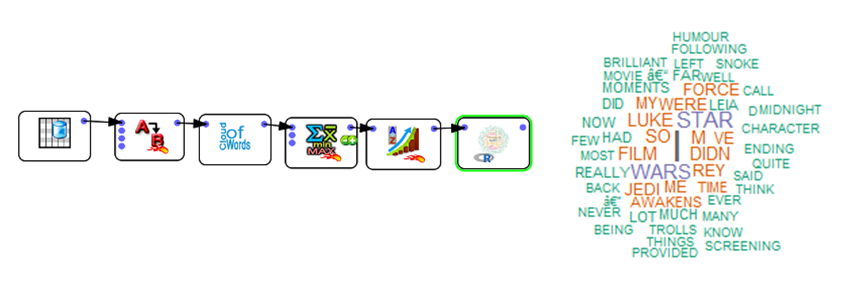
The second way require generating data for the cloud of word from a text. Let’s explore a star wars review form December 21, 2018 (http://www.trustedreviews.com/opinion/star-wars-the-last-jedi-spoilers-ending-3356585):
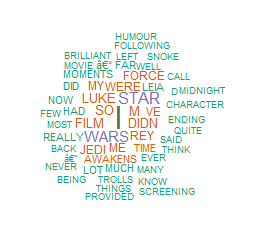
First, we “normalize” our text data (set all to lower case, remove punctuation, remove accents), and we use the “Cloud of Word” action from “Text Mining”, we then aggregate the data and send to the R Cloud of Word action:
