|
<< Click to Display Table of Contents >> Navigation: 5. Detailed description of the Actions > 5.11. TA - R Visualization > 5.11.7. A priori (
|
Icon:![]()
Function: apriori
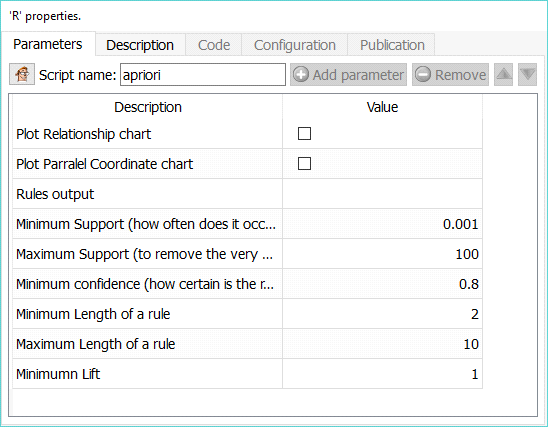
Property window:
Short description:
Computes a priori association rules. Provides the infrastructure for representing, manipulating and analyzing transaction data and patterns (frequent itemsets and association rules). Also provides interfaces to C implementations of the association mining algorithms Apriori and Eclat by C. Borgelt (https://cran.r-project.org/web/packages/arules/arules.pdf).
Long Description:
Apriori looks for patterns in transactional data. There are many additional parameters in this package https://cran.r-project.org/web/packages/arules/arules.pdf that are not defined as user-parameters in this Anatella action, feel free to complete the current list of parameters with any additional parameters to your liking.
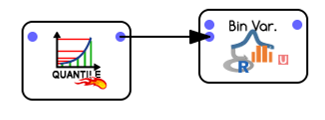
Unlike other implementation, this action does not require the data to be in transactional form (such an invoice) as it will look for patterns across columns, so very little data preparation is needed. Basically, we need the data in the form of one line per transaction, with ALL DATA CATEGORICAL. If you have continuous data, such as age, or income, use the quantile and BinVar functionalities to recode them
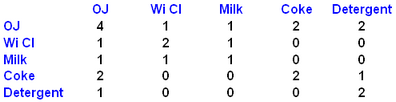
The data you typically will analyze looks like:
The goal of association rules it to establish relationships. Here is an example:
Rules are detected and kept based on two criterion: Support and Confidence
•Support: How often is the rule occurred? (usefulness)
It is the percentage of transactions that contains all items in the rule
oSupport (A ⇒ B) = P(A ∩ B)
oExample: For the rule “If Coke then OJ” (or “if OJ then Coke“): In all 5 transactions, 2 contains both coke and OJ. The support of the rule is 40%
•Confidence: How certain is the rule?
oConfidence (A ⇒ B) = P(B | A)
oExample1 :
oThe rule ("If Coke then OJ") has a confidence of 100% because “Coke ⇒ OJ = 2 / 2 = 1 (100%)”
oExample2: What is the confidence of the rule "If OJ then Coke"?
Out of the 4 transactions with OJ, only 2 have coke
Confidence OJ ⇒ Coke = 2 / 4 = 0.5 (50%)
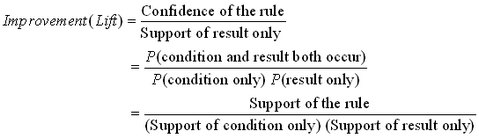
Useful rules have improvement (lift) greater than 1. The lift is defined as:
There can be hundreds of thousands of rules in a data set, so if you try to plot it, R will simply die on you.
Use this functionalities in two steps:
1.Identify the rules you want to work with
▪Set the confidence and support (it is a good idea to look for relatively high confidence, and low support, to avoid finding the the water is wet)
▪Minimum support
▪Maximum Support
▪Minimum Confidence
▪Minimum Length of a rule: how many items do we want on the “left side” of the relationship? Longer rules make analisis quite complex, small rules are usually very obvious
▪Maximum strength of a rule: same as above
▪Minimum Lift: minimum criteria to keep a rule. Alift of 1 means that there is no “gain of knowledge” with this rule, that is there is correlation, most likely not causality.
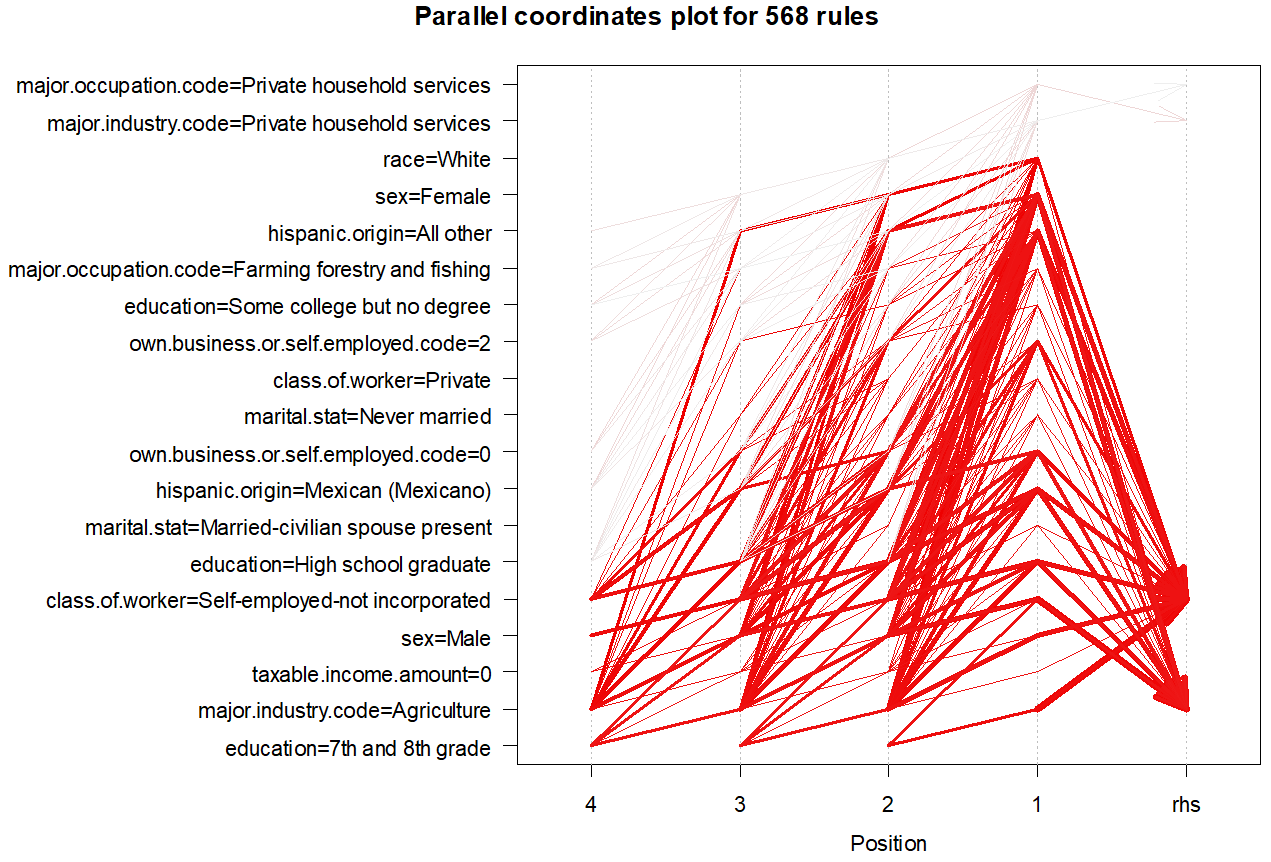
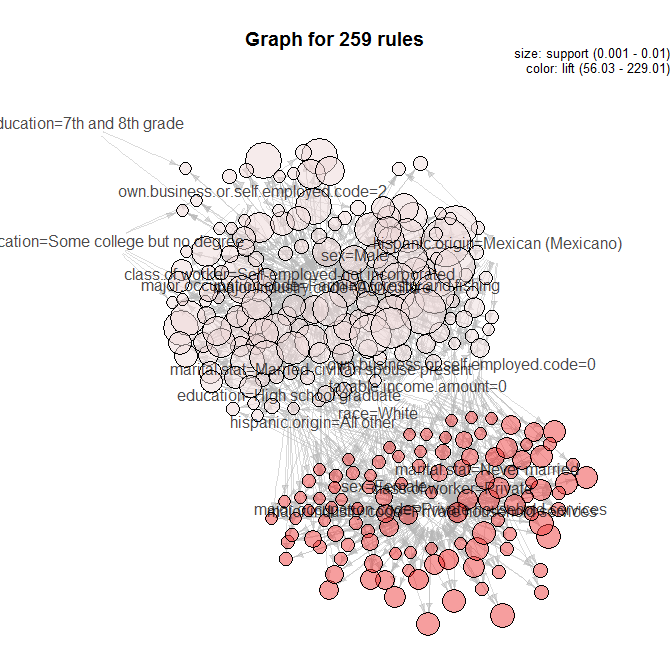
2.Once you have selected the rules that are interesting, you may want to graphically explore your data by selected the two chart options: