|
<< Click to Display Table of Contents >> Navigation: 5. Detailed description of the Actions > 5.11. TA - R Visualization > 5.11.4. Correlation Matrix (
|
Icon: ![]()
Function: R_CorrMatrix
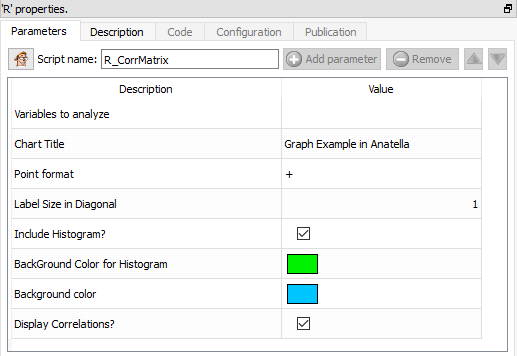
Property window:

Short description:
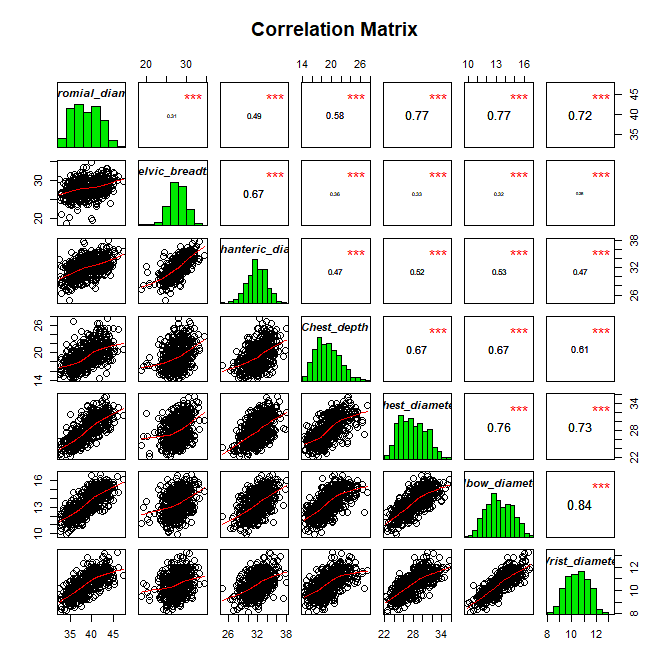
Display a correlation matrix.
Long Description:
This is usefull to visually check if some variables are correlated.
There are two versions of Correlation Matrix included in Anatella, one uses regular plots, and allows the combination of scatter pluts, histogram and trends (moving average)

While this offers a sound understanding of the variable distributions, and perhaps provides a better representation of the data, this is not the mode “business ready” visualization.