Let’s start with a really simple example. We will create an Anatella-Data-Transformation-Graph (or, in short, a “graph”) that reads a CSV/Text file.
When you run Anatella (e.g. when you double-click on the Anatella icon on your desktop to open it), Anatella automatically creates a “blank” (empty) graph that is directly ready for you to use it.
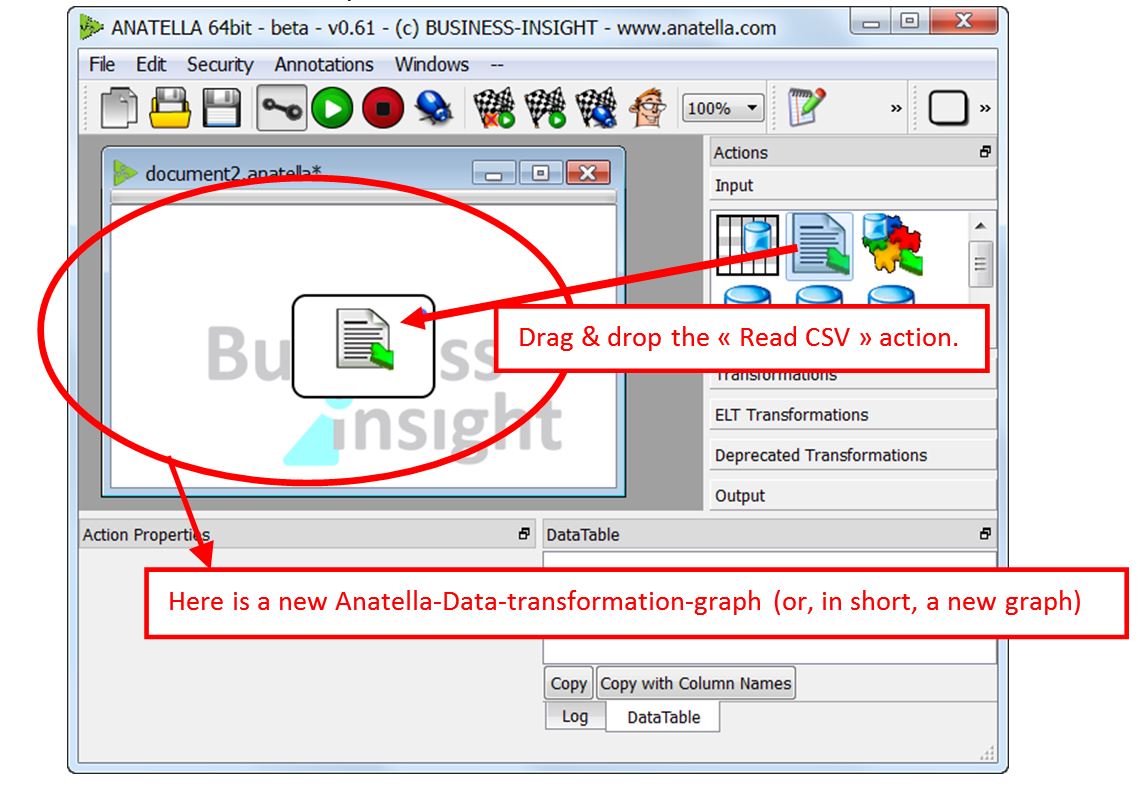
Use your mouse to drag & drop into the central window the ![]() icon (taken from the right-side-panel). This icon represents a “CSV/Text file reader”: it allows you to read the content of a CSV/Text file. Here is an illustration of the procedure:
icon (taken from the right-side-panel). This icon represents a “CSV/Text file reader”: it allows you to read the content of a CSV/Text file. Here is an illustration of the procedure:
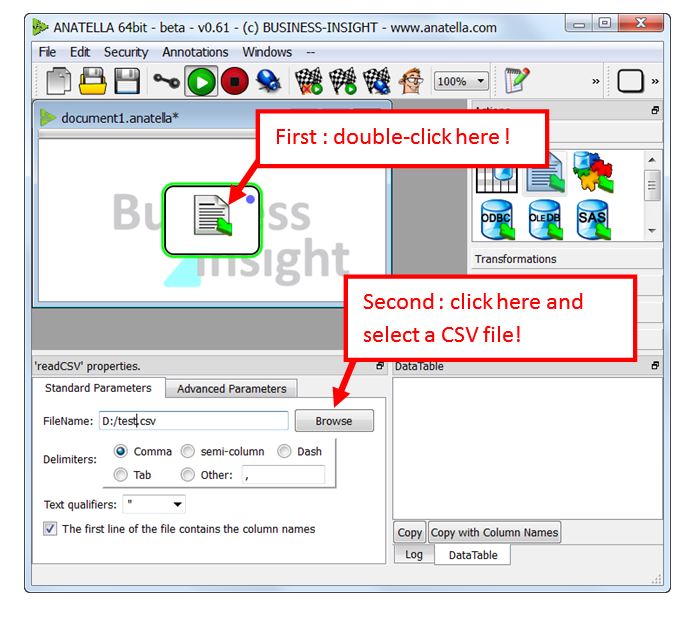
Thereafter, double-click the ![]() icon inside the Anatella Graph: This will open the configuration screen of the “CSV file reader”. Click on the
icon inside the Anatella Graph: This will open the configuration screen of the “CSV file reader”. Click on the ![]() button and select a test CSV file. You should obtain something like this:
button and select a test CSV file. You should obtain something like this:
We just created a very small Anatella-Graph that reads a CSV/Text file named “d:\test.csv”. Now, we would like to know if the settings of the “CSV File reader” are correct (Is it the right file? Is it the right separator?).
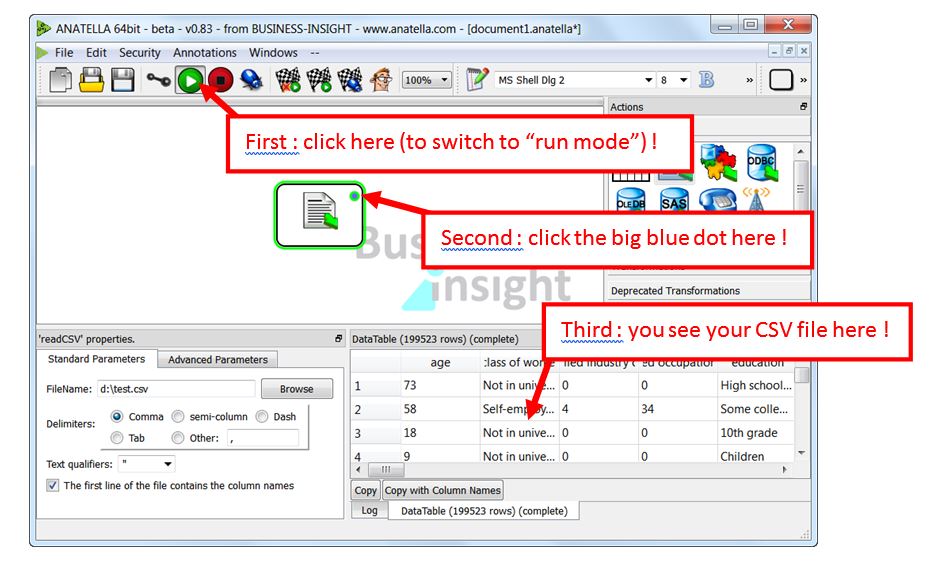
To check if the settings are correct, we would like to “see” the CSV file. Click the ![]() button in the main toolbar (we just switched to “Run mode”) and thereafter click the “big blue dot” inside the “CSV file reader” box. This “big blue dot” is named an “ouput pin” and it represents the “output table” of the Action. Here is an illustration of the procedure:
button in the main toolbar (we just switched to “Run mode”) and thereafter click the “big blue dot” inside the “CSV file reader” box. This “big blue dot” is named an “ouput pin” and it represents the “output table” of the Action. Here is an illustration of the procedure: