For those of you that are in a hurry and already know everything there is to know about TIMi, PCA, K-means algorithm and Ward’s Algorithm, you can directly obtain a segmentation in less than 30 seconds and 5 mouse clicks in this way:
1.Run StarDust (click on the StarDust icon ![]() or on the
or on the ![]() button inside the “.TypeXML file” editor). (This is mouse click “1”).
button inside the “.TypeXML file” editor). (This is mouse click “1”).
2.Open a dataset: To open a dataset a dataset in Stardust, you must actually open the associated “.DescXML file”. Click the ![]() button and browse for the “.DescXML file” associated with the dataset that you want to analyze. (This is mouse click “2”).
button and browse for the “.DescXML file” associated with the dataset that you want to analyze. (This is mouse click “2”).
3.A new window appears:
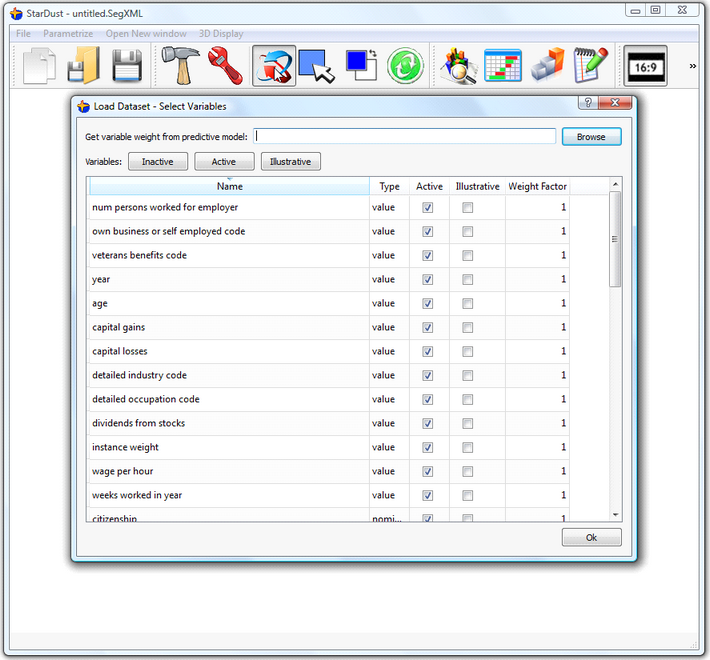
This window allows you to, basically, select which column will be loaded into memory for analysis. For more information on this window, see the end of section 4.2.2. You can directly click the ![]() button (This is mouse click “3”).
button (This is mouse click “3”).
4.The next “parameter window” allows you to configure the normalization of the variables, the PCA, the distance used inside the clustering algorithms (Euclidean, Cosine, Etc.), the K-means algorithm parameters in itself, the Ward’s algorithm, the 3D display and so on... You can use the default values for all settings: click the ![]() button (This is mouse click “4”).
button (This is mouse click “4”).
5.You get a first 3D view of your population. You can already directly “see for yourself” the segments (and some outliers). You obtain something like that:
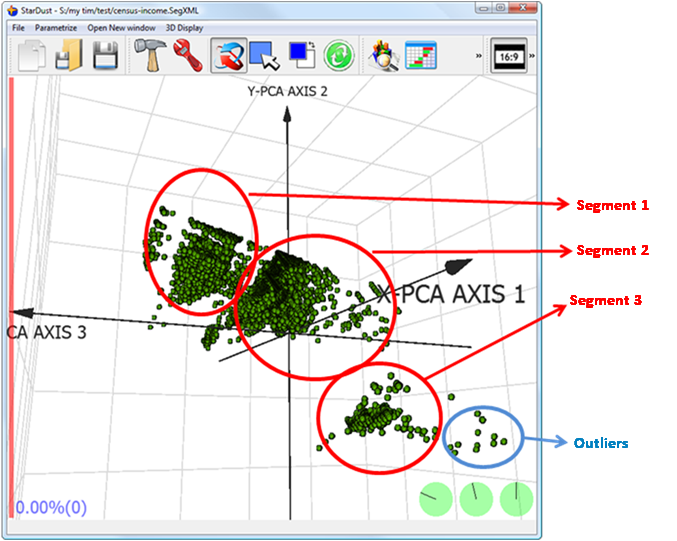
If you cannot see any segments, it means that you dataset most certainly contains some outliers, see section 5.4.1 to know how to remove them.
See the section 5.3 to know how to configure this 3D display to easily explore all your data. You can also use the very powerful “multivariate PCA zooming” techniques described in section 5.4.2 to visually explore more precisely a specific subset of your dataset.
6.Click repetitively on the ![]() button to obtain different segmentations (This is the final mouse click: mouse click number “5”). Each time you click on the
button to obtain different segmentations (This is the final mouse click: mouse click number “5”). Each time you click on the ![]() button, a completely new segmentation is computed and shown.
button, a completely new segmentation is computed and shown.
The (many) parameters used to create the segments are all accessible when you click the ![]() button or the
button or the ![]() button. The main difference between the
button. The main difference between the ![]() button and the
button and the ![]() button is that the later is applying your modifications “in real-time”: i.e. You don’t have to click the
button is that the later is applying your modifications “in real-time”: i.e. You don’t have to click the ![]() button to see the result of your modifications: you can directly see “in real-time” all the windows of StarDust updating.
button to see the result of your modifications: you can directly see “in real-time” all the windows of StarDust updating.
See section 5.5 to know more about all the different parameters of the segmentation algorithm of StarDust.
For example, the most important parameter is the number of segments that you want to obtain. To choose the right number of segments, click the ![]() button and select the “segmentation 2” tab: The position of the vertical red line inside the following window defines the number of segment that you want (in the example below we want 4 segments):
button and select the “segmentation 2” tab: The position of the vertical red line inside the following window defines the number of segment that you want (in the example below we want 4 segments):
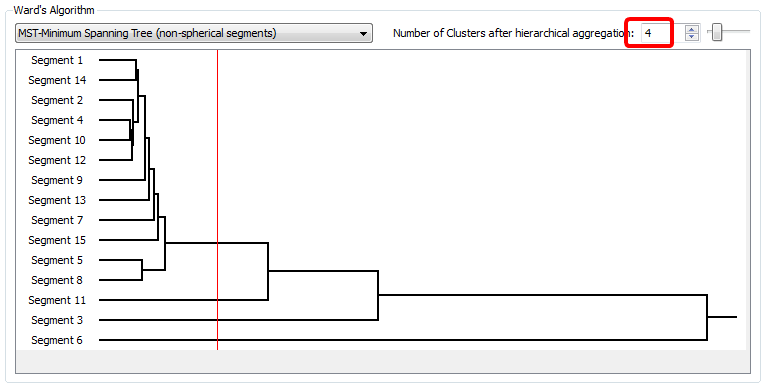
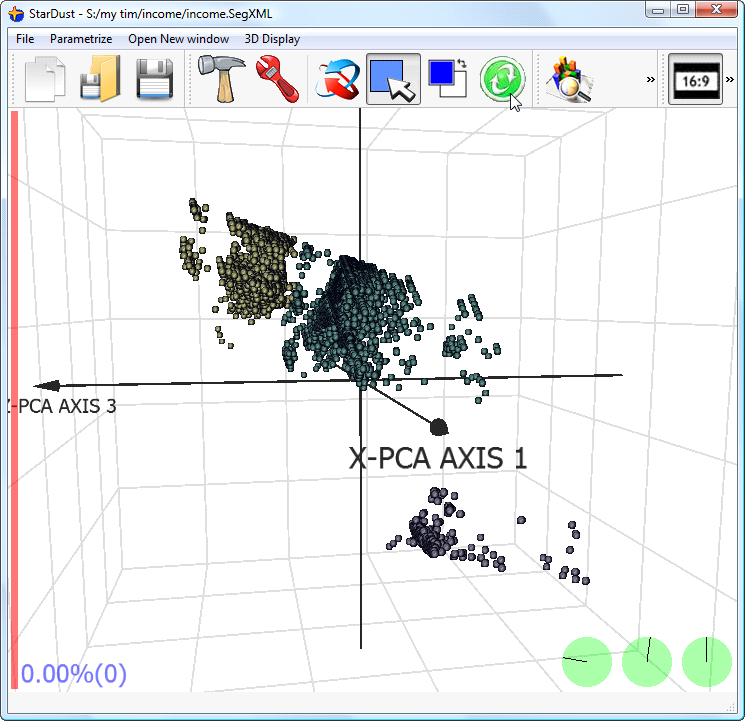
Click anywhere inside the “hierarchical-tree” window to move the red line: it changes the number of segments (See section 5.5.3 to have more information about this window and the Ward’s algorithm). You can instantaneously see the results of your decision inside the main 3D display window: When you move the red vertical line with your mouse, it changes the (number of) segments and the colours of the points inside the main 3D display are (instantaneously) changing. Inside the main 3D display, each colour represents a different segment: for example, in the example below there are 3 segments (because there are 3 different colours: yellow, purple, blue turquoise):
7.Once you have found a nice segmentation, you can save the segmentation model, to use it later in combination with TIMi: Select the “segmentation 3” tab and click the “export” button:

(See section 5.5.6 for more information on segmentation models)
8.You can also “explain” the different segments, using different charts and summary tables. See sections 5.5.7 and 5.2.12 to know how to create nice and colourful reports that explains your segments to the business- users.