Each row of the dataset is an individual that will be represented by a small green 3D point. Stardust computes the 3D coordinates of each individual using the PCA technique (see section 2.1. about “dimensionality reduction”). You can configure which variable will be used inside the PCA on this screen:
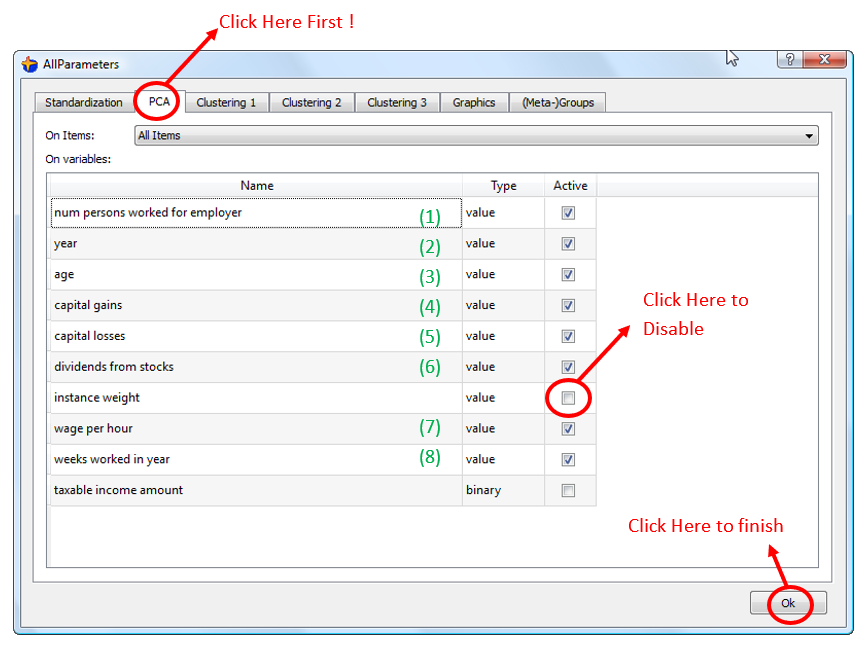
With the above settings, each individual is, at the very beginning, a point in a 8 dimensional space. Thanks to the PCA technique, we will obtain 3D coordinates for each individual as illustrated on the next StarDust screen:
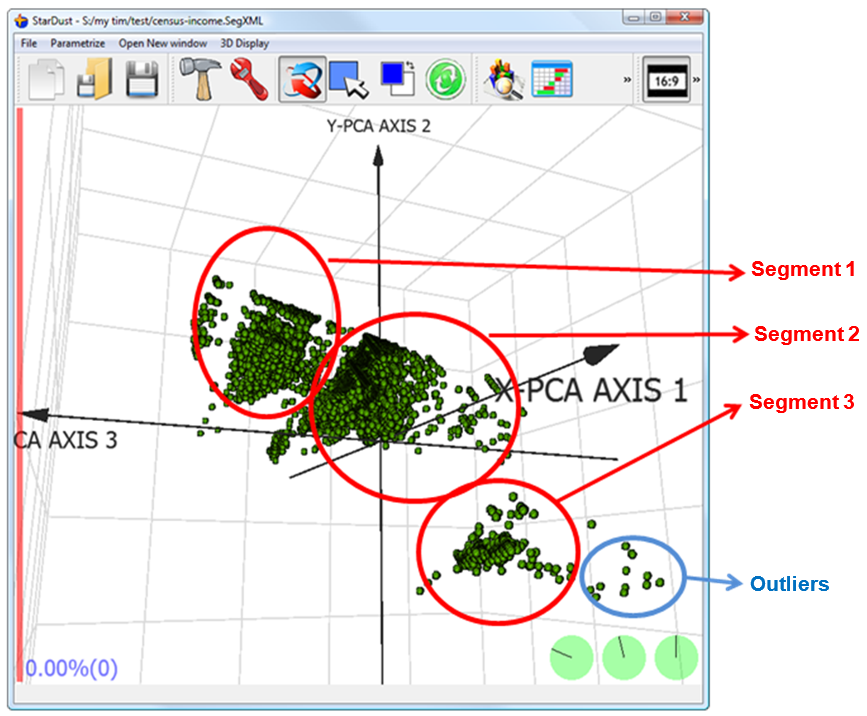
Inside the census-income database there are around 200 thousand individuals. This means that we are actually looking at a graph that contains 200 thousand points. We can zoom-in, rotate around the graph in 3 Dimension and in real-time.
Using Stardust, you can directly « see » for yourself the 3 segments inside the dataset. By simple visual inspection, you discover existing, natural segments inside your population. You can even see some outliers.