|
<< Click to Display Table of Contents >> Navigation: 5. Detailed description of the Actions > 5.7. Data Mining > 5.7.2. Confusion Matrix (High-Speed
|
Icon: ![]()
Function: ConfusionMatrix
Property window:
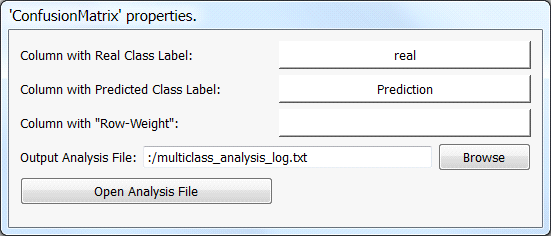
Short description:
Analyze the performances of multi-class predictive models.
Long Description:
Binary predictive models or continous predictive models are typically built with TIMi and TIMi automatically delivers a set of graphical report that allows you to easily estimate the quality/accuracy of your models. These reports contain AUC (for binary classification) or R² (for continuous predicition) that allows you to easily select the best models.
To estimate the quality of your Multi-class predictive models (which are typically built using the ![]() TIMiModelMerger Action), you need to “manually” use the
TIMiModelMerger Action), you need to “manually” use the ![]() ConfusionMatrix Action.
ConfusionMatrix Action.
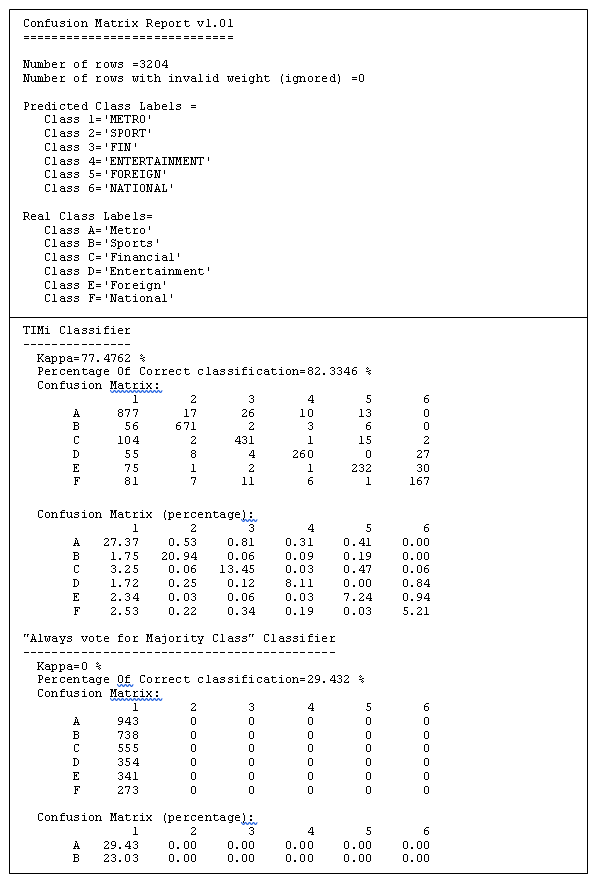
The ![]() ConfusionMatrix Action produces an analysis report containing:
ConfusionMatrix Action produces an analysis report containing:
•The accuracy of your Multi-class predictive model.
•The accuracy of the “constant” Multi-class predictive model (i.e. the accuracy of the predictive model that always gives as answer the majority class). This is useful because it gives you “baseline” on which to compare your predictive model. The question is: “Is your predictive model really better than the simple “constant” predictive model?”.
•The confusion matrix of your Multi-class predictive model.
Inside the report, this matrix has 2 representations:
oEach cell contains an absolute value of the number of examples inside your scoring dataset.
oEach cell contains a percentage compared to the total number of examples inside your scoring dataset.
•The kappa statistic of your Multi-class predictive model. The Kappa statistics is the de-facto standard when estimating the accuracy of a multi-class classifier. For more information about the Kappa statistics: http://en.wikipedia.org/wiki/Cohen%27s_kappa
The “percentage of correct classification” and the “correlation coefficient” are inappropriate statistics when measuring the agreement between the predicted class and the real observed class. The correct statistic is Kappa because it corrects the proportion of agreement due to chance. Here is a table that helps you interpret the strength of the agreement:
Value of κ (kappa) |
Strength of agreement |
≤0.20 |
Poor |
0.21 - 0.40 |
Fair |
0.41-0.60 |
Moderate |
0.61-0.80 |
Good |
0.81-1.00 |
Very good |
Here is an example of report:
Using the ![]() ConfusionMatrix Action, you can quickly find which one of your many different Multi-class predictive models is the best (i.e. which one has the highest accuracy).
ConfusionMatrix Action, you can quickly find which one of your many different Multi-class predictive models is the best (i.e. which one has the highest accuracy).